
MONTHLY SEA SURFACE TEMPERATURE ANOMALY MAP
The following is a Global map of Reynolds OI.v2 Sea Surface Temperature (SST) anomalies for January 2013. It was downloaded from the NOMADS website. The contour levels are set at 0.5 deg C, and white is set at zero.
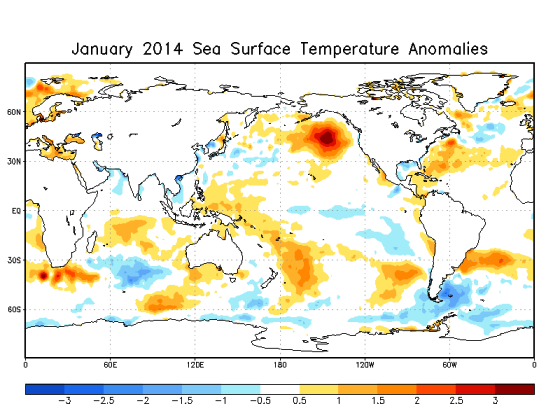
January 2013 Sea Surface Temperature (SST) Anomalies Map
(Global SST Anomaly = +0.201 deg C)
MONTHLY OVERVIEW
The sea surface temperature anomalies for the NINO3.4 region in the eastern equatorial Pacific (5S-5N, 170E-120E) are a commonly used index for the strength, frequency and duration of El Niño and La Nina events. We keep an eye on the sea surface temperatures there because El Niño and La Niña events are the primary cause of the yearly variations in global sea surface temperatures AND they are the primary cause of the long-term warming of global sea surface temperatures over the past 30 years. See the discussion of the East Pacific versus the Rest-of-the-World that follows.
Monthly NINO3.4 sea surface temperature anomalies are still cycling back and forth across zero. Recently, they’ve cooled about -0.52 deg C, so they’re approaching the threshold of La Niña conditions. They’re presently at +0.47 deg C. They’re still well within El Niño-Southern Oscillation (ENSO)-neutral conditions, meaning they’re not El Niño or La Niña conditions. Also refer to the discussion of the weekly NINO3.4 data near the bottom of the post.
Global Sea Surface Temperature anomalies remained basically the same as last month, with a slight drop (-0.007 deg C) from December to January. The Northern Hemisphere cooled while the Southern Hemisphere warmed. Only three ocean basins showed cooling in January: the Indian Ocean, the North Atlantic and the North Pacific. The monthly Global Sea Surface Temperature anomalies are presently at +0.201 deg C.

(1) Global Sea Surface Temperature Anomalies
Monthly Change = -0.007 deg C
####################################

(2) NINO3.4 Sea Surface Temperature Anomalies
(5S-5N, 170W-120W)
Monthly Change = -0.519 deg C
####################################
THE EAST PACIFIC VERSUS THE REST OF THE WORLD
(Note: I have eliminated the volcano adjustments in the following presentations of East Pacific and Rest of the World sea surface temperature anomalies. The last month with the volcano adjustments was August 2013. See the post here.)
The East Pacific and the Rest-Of-The-World (Atlantic-Indian-West Pacific) datasets were first discussed in the post Sea Surface Temperature Anomalies – East Pacific Versus The Rest Of The World, and were discussed a few months later in How Can Things So Obvious Be Overlooked By The Climate Science Community?
They were also discussed in great detail in my recently published book Who Turned on the Heat? The Unsuspected Global Warming Culprit, El Niño-Southern Oscillation. The Free Preview includes the Table of Contents; the Introduction; the beginning of Section 1, with the cartoon-like illustrations; the discussion About the Cover; and the Closing. Also see the blog post Everything You Every Wanted to Know about El Niño and La Niña… for an overview. The book is only US$8.00 US$5.00. Please click here to buy a copy. (Paypal or Credit/Debit Card. You do not need to open a PayPal account.)
The global oceans were divided into these two subsets to illustrate a couple of facts. First, the linear trend of the East Pacific (90S-90N, 180-80W) Sea Surface Temperature anomalies since the start of the Reynolds OI.v2 dataset is so low it’s basically flat. (Note that the region also includes portions of the Arctic and Southern Oceans.) That is, there has been little to no warming of sea surface temperatures on the East Pacific (from pole to pole) in 32 years. The East Pacific is not a small region. It represents about 33% of the surface area of the global oceans. The East Pacific linear trend varies very slightly with each monthly update. But it won’t vary significantly between El Niño and La Niña events.

(3) East Pacific Sea Surface Temperature (SST) Anomalies
(90S-90N, 180-80W)
####################################
And second are the Sea Surface Temperature anomalies for the Rest of the World (90S-90N, 80W-180). This region includes the Atlantic Indian and West Pacific Oceans, with the corresponding portions of the Arctic and Southern Oceans. Sea surface temperatures there warmed in very clear steps, in response to the significant 1986/87/88 and 1997/98 El Niño/La Niña events. It also appears as though the Sea Surface Temperature anomalies of this dataset January have made another upward shift in response to the 2009/10 El Niño and 2010/11 La Niña events. For those who are interested in the actual trends of the Sea Surface Temperature anomalies between the 1986/87/88 and 1997/98 El Niño events and between the 1997/98 and 2009/10 El Niño events refer to Figure 4 in Does The Sea Surface Temperature Record Support The Hypothesis Of Anthropogenic Global Warming? I further described (at an introductory level) the ENSO-related processes that cause these upward steps in the post ENSO Indices Do Not Represent The Process Of ENSO Or Its Impact On Global Temperature. And as noted above, it is discussed in detail in my ebook Who Turned on the Heat? The Unsuspected Global Warming Culprit, El Niño-Southern Oscillation.

(4) Sea Surface Temperature Anomalies For The Rest of the World
(90S-90N, 80W-180)
####################################
The periods used for the average Rest-Of-The-World Sea Surface Temperature anomalies between the significant El Niño events of 1982/83, 1986/87/88, 1997/98, and 2009/10 are determined as follows. Using the original NOAA Oceanic Nino Index (ONI) for the official months of those El Niño events, I shifted (lagged) those El Niño periods by six months to accommodate the lag between NINO3.4 SST anomalies and the response of the Rest-Of-The-World Sea Surface Temperature anomalies, then deleted the Rest-Of-The-World data that corresponds to those significant El Niño events. I then averaged the Rest-Of-The-World SST anomalies between those El Niño-related gaps.
The “Nov 2010 to Present” average varies with each update. As noted in the post Sea Surface Temperature Anomalies – East Pacific Versus The Rest Of The World, it will be interesting to see where that Sea Surface Temperature anomaly average settles out, if it does, before the next significant El Niño drives them higher.
Of course, something could shift. Will the upward ratcheting continue when the Atlantic Multidecadal Oscillation (AMO) decides to turn around and start its decline? The upward steps would not continue in the North Atlantic, but would the AMO impact the upward steps in other portions of the globe? For more information about the Atlantic Multidecadal Oscillation, refer to the post An Introduction To ENSO, AMO, and PDO — Part 2.
The Sea Surface Temperature anomalies of the East Pacific Ocean, or approximately 33% of the surface area of the global oceans, have shown little to no long-term warming since 1982 based on the linear trend. And between upward shifts, the Sea Surface Temperature anomalies for the rest of the world (67% of the global ocean surface area) remain relatively flat. As discussed in my book, anthropogenic forcings are said to be responsible for most of the rise in global surface temperatures over this period, but the Sea Surface Temperature anomaly graphs of those two areas prompt a two-part question: Since 1982, what anthropogenic global warming processes would overlook the Sea Surface Temperatures of 33% of the global oceans and have an impact on the other 67% but only during the months of the significant El Niño events of 1986/87/88, 1997/98 and 2009/10?
STANDARD NOTE ABOUT THE DATA
The MONTHLY graphs illustrate raw monthly OI.v2 sea surface temperature anomaly data from November 1981 to January 2014, as it is presented by the NOAA NOMADS website linked at the end of the post. NOAA uses the base years of 1971-2000 for this dataset. I’ve added the 13-month running-average filter to smooth out the seasonal variations.
MONTHLY INDIVIDUAL OCEAN AND HEMISPHERIC SEA SURFACE TEMPERATURE UPDATES

(5) Northern Hemisphere Sea Surface Temperature (SST) Anomalies
Monthly Change = -0.061 deg C
####################################

(6) Southern Hemisphere Sea Surface Temperature (SST) Anomalies
Monthly Change = +0.036 deg C
####################################

(7) North Atlantic Sea Surface Temperature (SST) Anomalies
(0 to 70N, 80W to 0)
Monthly Change = -0.031 deg C
####################################

(8) South Atlantic Sea Surface Temperature (SST) Anomalies
(0 to 60S, 70W to 20E)
Monthly Change = +0.108 deg C
Note: I discussed the (now apparently temporary) upward shift in the South Atlantic Sea Surface Temperature anomalies in the post The 2009/10 Warming Of The South Atlantic. Prior to that shift, the South Atlantic sea surface temperature anomalies had been relatively flat for about two decades. It now looks as though the South Atlantic sea surface temperature anomalies have dropped below the level they were at before that surge.
####################################

(9) Pacific Sea Surface Temperature (SST) Anomalies
(60S to 65N, 120E to 80W)
Monthly Change = -0.026 Deg C
####################################

(10) North Pacific Sea Surface Temperature (SST) Anomalies
(0 to 65N, 100E to 90W)
Monthly Change = -0.083 Deg C
####################################

(11) South Pacific Sea Surface Temperature (SST) Anomalies
(0 to 60S, 120E to 70W)
Monthly Change = +0.024 deg C
####################################

(12) Indian Ocean Sea Surface Temperature (SST) Anomalies
(60S to 30N, 20E to 120E)
Monthly Change = -0.078 deg C
####################################

(13) Arctic Ocean Sea Surface Temperature (SST) Anomalies
(65N to 90N)
Monthly Change = +0.080 deg C
####################################

(14) Southern Ocean Sea Surface Temperature (SST) Anomalies
(90S-60S)
Monthly Change = +0.042 deg C
####################################
WEEKLY SEA SURFACE TEMPERATURE ANOMALIES
The NINO3.4 Sea Surface Temperature anomalies based on the week centered on February 5, 2014 are now cooler than the -0.5 deg C threshold of La Niña conditions. They are presently at -0.71 deg C. It’s a little late in the 2013/14 ENSO season and way too early in the 2014/15 ENSO season for a full La Niña to form.

(15) Weekly NINO3.4 Sea Surface Temperature (SST) Anomalies
####################################
Weekly global sea surface temperature anomalies are at +0.22 deg C.

(16) Weekly Global Sea Surface Temperature (SST) Anomalies
####################################
INTERESTED IN LEARNING MORE ABOUT HOW AND WHY THE GLOBAL OCEANS INDICATE THEY’VE WARMED NATURALLY?
Why should you be interested? The hypothesis of manmade global warming depends on manmade greenhouse gases being the cause of the recent warming. But the sea surface temperature record indicates El Niño and La Niña events are responsible for the warming of global sea surface temperature anomalies over the past 32 years, not manmade greenhouse gases. Scroll back up to the discussion of the East Pacific versus the Rest of the World. I’ve searched sea surface temperature records for more than 4 years, and I can find no evidence of an anthropogenic greenhouse gas signal. That is, the warming of the global oceans has been caused by Mother Nature, not anthropogenic greenhouse gases.
I’ve recently published my e-book (pdf) about the phenomena called El Niño and La Niña. It’s titled Who Turned on the Heat? with the subtitle The Unsuspected Global Warming Culprit, El Niño Southern Oscillation. It is intended for persons (with or without technical backgrounds) interested in learning about El Niño and La Niña events and in understanding the natural causes of the warming of our global oceans for the past 30 years. Because land surface air temperatures simply exaggerate the natural warming of the global oceans over annual and multidecadal time periods, the vast majority of the warming taking place on land is natural as well. The book is the product of years of research of the satellite-era sea surface temperature data that’s available to the public via the internet. It presents how the data accounts for its warming—and there are no indications the warming was caused by manmade greenhouse gases. None at all.
Who Turned on the Heat? was introduced in the blog post Everything You Ever Wanted to Know about El Niño and La Niña… …Well Just about Everything. The Free Preview includes the Table of Contents; the Introduction; the beginning of Section 1, with the cartoon-like illustrations; the discussion About the Cover; and the Closing.
Please buy a copy. (Paypal or Credit/Debit Card). You do not need to have a PayPal account. Simply scroll down to the “Don’t Have a PayPal Account” purchase option. It’s now sale priced at US$5.00.
Sales of my books and tips/donations will allow me to return to blogging full time. Please consider making your tip a small monthly amount, by selecting monthly on the PayPal donations/tip link.
SOURCES
The Sea Surface Temperature anomaly data used in this post is available through the NOAA NOMADS website:
http://nomad1.ncep.noaa.gov/cgi-bin/pdisp_sst.sh
or:


Thanks Bob. We keep on waiting and watching for ENSO to decide.
If both El Nino and his sister warm the oceans (SST), when does offsetting cooling occur?
Brian H: The satellite-era sea surface temperature records don’t show offsetting ENSO cooling outside of the East Pacific. For the South Atlantic, Indian and West Pacific oceans, ENSO acts as a chaotic, sunlight-fueled, naturally occurring, recharge-discharge oscillator, so I can’t see how an offsetting cooling mode fits into that description.
But, the sea surface temperatures of the South Atlantic, Indian and West Pacific oceans show decadal cooling between strong El Niño events:

That graph is from the post here:
Be interested to know if the current storms coming of the Atlantic and hitting Britain & Western Europe will take any of the heat out of the Ocean?
Pingback: El Niño or La Nada for the 2014/15 ENSO Season | Bob Tisdale – Climate Observations
Pingback: El Niño or La Nada for the 2014/15 ENSO Season | Watts Up With That?
I’d love to see some calculations on heat dissipation of the North Pacific hotspot. I presume it’s a much slower process up north due to less water vapour transport from sea surface to upper atmosphere.
Re: mwhite says:
February 12, 2014 at 1:44 pm
Be interested to know if the current storms coming of the Atlantic and hitting Britain & Western Europe will take any of the heat out of the Ocean?
EVERY storm takes heat out of the oceans! The evaporation process associated with storm events are the great heat transfer processes that add heat (molecular motion) to the atmosphere and transport such over land areas where rainfall releases that same heat.
So both storm frequency and intensity are involved, and your surmise is correct!
Pingback: the search for the ‘missing heat’ … found | pindanpost
The NASA scientist Jan P. Perlwitz has recently written in the German blog http://donnerunddoria.welt.de/2014/02/28/erneut-bestaetigt-eine-studie-sonne-hat-die-erderwaermung-gestoppt/ the following comment on your post: “…Was dort gezeigt wird, ist die Temperaturanomalie an der Oberflaeche der Ozeane, die skin temperature. Das ist die Schnittstelle zwischen Atmosphaere und Ozeanen. Ich sprach von den obersten Schichten der Ozeane, nicht von der Ozeanoberflaechentemperatur, im Vergleich zu den tieferen Schichten. Die Temperatur an der Oberflaeche ist keine geeignete Metrik fuer die Temperaturentwicklung der Wassermasse in den Ozeanen, nicht mal fuer die oberen 100 Meter. Hier ist dagegen eine graphische Representation der globalen Ozeanerwaermung zu finden, fuer die mittlere Temperaturzunahme der oberen 100, 700 und 2000 Meter der Ozeane: http://climateconomysociety.bl… Die Erlaeuterung dazu ist im Text zu finden. Was Bob Tisdale betrifft, auf dessen Meinungsblog Sie hier verwiesen haben. Tisdale behauptet ja, die globale Ozeanerwaermung wuerde durch Ozeanerwaermung verursacht. Er behauptet, die Ozeane wuerden sich sozusagen spontan, von selbst erwaermen, ohne dass es eines Nettoenergiezuflusses in die Ozeane beduerfe, was eine Verletzung des Energieerhaltungssatzes ist. Die Ozeane haben keine innere diabatische Energiequelle, die so eine Erwaermung verursachen wuerde. Die Stoerung im Energiefluss durch anthropogene Treibhausgase darf wiederum nicht die Ursache sein. Das ist der axiomatische Ausgangspunkt fuer alle AGW-Bestreiter. Stattdessen verbreitet Tisdale dann tautologischen, unphysikalischen Unsinn, junk science in seinem Meinungsblog. Irgendwelche wissenschaftlichen Veroeffentlichungen mit Ergebnissen von Tisdales “Forschung” gibt es nicht”. The comment is in German but I hope you might find somebody who could translate it into English for you.
Thanks, GruenIn. He and I do not see eye to eye, so I imagine he was not agreeing with my findings.