
INTRODUCTION
Chapter 4-7 of If the IPCC was Selling Manmade Global Warming as a Product, Would the FTC Stop their deceptive Ads? included comparisons of the CRUTEM3 Land Surface Temperature anomalies to the multi-model mean of the CMIP3 climate models. For those who have purchased the book, see page 99. As you will recall, CMIP3 stands for Phase 3 of the Coupled Model Intercomparison Project, and CMIP3 served as the source of the climate models used by the Intergovernmental Panel on Climate Change (IPCC) for their 4th Assessment Report (AR4). CRUTEM3 is the land surface temperature data available from the Met Office Hadley Centre and the Climatic Research Unit at the University of East Anglia.
This post compares the new and improved CRUTEM4 land surface temperature anomaly data to the same CMIP3 multi-model mean. CRUTEM4 data was documented by the 2012 Jones et al paper Hemispheric and large-scale land surface air temperature variations: An extensive revision and an update to 2010. I’ve used the annual time-series data, specifically the data in the second column here, changing the base years for anomalies to 1901 to 1950 to be consistent with Figure 9.5 of the IPCC’s AR4.
And, as I had with the other 20th Century Model-Observations comparisons, the two datasets are broken down into the 4 periods that are acknowledged by the IPCC in AR4. These include the early “flat temperature” period from 1901 to 1917, the early warming period from 1917 to 1938, the mid-20th Century ‘flat temperature” period from 1938 to 1976, and the late warming period. The late warming period in the chapter 4-7 comparisons in If the IPCC was Selling Manmade Global Warming as a Product, Would the FTC Stop their deceptive Ads? ended in 2000. For the late warming period comparisons in this post, I’ve extended the model and CRUTEM4 data to 2010.
COMPARISONS
As shown in Figure 1, and as one would expect, the models do a good job of simulating the rate at which the CRUTEM4-based global land surface temperatures rose during the late warming period of 1976 to 2010.

Figure 1
But like CRUTEM3 data, that’s the only period when the IPCC’s climate models came close to matching the CRUTEM4-based observed linear trends.
According to the CMIP3 multi-model mean, land surface temperatures should have warmed at a rate of 0.043 deg C per decade from 1938 to 1976, but according to the CRUTEM4 data, global land surface temperature anomalies cooled at a rate of -0.05 deg C per decade, as shown in Figure 2.

Figure 2
Figure 3 compares the models to the global CRUTEM4 data during the early warming period of 1917 to 1938. The observed rate at which global land surface temperatures warmed is almost 5 times faster than simulated by the IPCC’s climate models. 5 times faster.

Figure 3
And in Figure 4, the models are shown to be unable to simulate the very slow rate at which land surface temperatures warmed during the early “flat temperature” period.
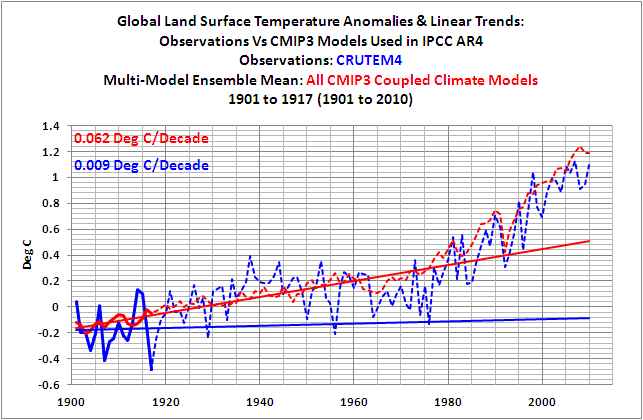
Figure 4
According to the models, the linear trend of the global land surface temperatures during the late warming period should be 6.6 times higher than during the early warming period. See Figure 5.

Figure 5
Yet according to the new and improved CRUTEM4 land surface temperature data, Figure 6, the land surface temperatures warmed during the late warming period at a rate that was only 40% higher than during the early warming period.

Figure 6
CLOSING
The models show no skill at being able to simulate the rates at which global land surface temperatures warmed and cooled over the period of 1901 to 2010. Why should we have any confidence in their being able to project global land surface temperatures into the future?
ABOUT: Bob Tisdale – Climate Observations
ebook (pdf and Kindle formats): If the IPCC was Selling Manmade Global Warming as a Product, Would the FTC Stop their deceptive Ads?
SOURCES
The CMIP3 multi-model mean data is available through the KNMI Climate Explorer
http://climexp.knmi.nl/selectfield_co2.cgi?id=someone@somewhere
And as noted in the post, the annual CRUTEM4 data is available through the Met Office website:
http://www.metoffice.gov.uk/hadobs/crutem4/data/diagnostics/global/nh+sh/index.html
Specifically:
http://www.metoffice.gov.uk/hadobs/crutem4/data/diagnostics/global/nh+sh/global_n+s


Pingback: Eye on Britain (2)
Pingback: Greenies acknowledge complexity for once : Stop The ACLU
Dear Bob, Question to you..
Why do this? And make it really sense?
Take a look at the Crut4 Map
Here: http://www.metoffice.gov.uk/hadobs/crutem4/index.html
Arctic/Antartic, Greenland not really recorded and the CMIP3 ist a full Global Modell. You have to cut out at least all nothern Latitude 80N and all southern 60S. And than you can make your comparison between Crutemp4 and CHIP3.
Alternativ you can use the Interpolated GISSTEMP…
Best regards
Christian, Germany
Hi Christian: I understand your concern, but there is very little difference between the multi-model mean of the CMIP3 Land Surface Temperature hindcasts for the entire globe (90S-90N) and the globe minus the poles (60S-80N):

The intent of this post was to show that the new CRUTEM4 dataset did not help the relationship between the models and the observations. With respect to your request for GISS, there is so little difference between the 3 land surface temperature datasets (Hadley Centre, GISS, or NCDC) that none of them really help the models during the periods before 1976.
Regards
Hi Bob,
i surprised about that, there have to be an generally problem CMIP3-Modell. Warming caused by extra radiation from atmosphere have the largest effect in the higher northern Latitudes. In the logical assumption to the “blackbody” Stefan-Bolzman-Law. But it could be, when you have only Land-data, you have no significant differences between high und low latitudes. On Landmass, there is not really a Timelag between radiation and warming.
Another Statement from me, i belive in AGW, but i dont belive that all things were told.
Should GISS perhaps be better for this Job? Against their criticism of the method with interpolate of 1.200km should it be that it works better with CMIP3, the most of really warming (you can read my post of this, http://forum.wetteronline.de/showthread.php?t=83096 (In German)) is since 1998 in the arctic region, nearly 0,7K in 14 years. And GISS interpolating shows up better the warming than the Hadley-Center. I say better, not good^^
Ok, another tip for you (i know, the Trend is my frind ^^) Detrend Crut4 and CMIP3 during you research periode, the differences come more out. Perhaps i do it..
Regards
Christian
Christian says: “i surprised about that, there have to be an generally problem CMIP3-Modell.”
There are many problems with the CMIP3 (and CMIP5) models. One of the most significant is how they simulate the warming of the oceans. See:
And:
Hi again,
I dont really understand your intention for this. So i have read your links, I know nobody who belives in Modell-Outputs, the reasion for this is easy, our understanding in climate is ok, but not good or well. What the IPCC says is not really important, its only the understanding on this time..
Until we understand the climate well,CHIMP3 and CHIMP5 will never reproduce the real messurements, i tink that is logical and no secret. Alone the ENSO and their powerfull Impact isnt really predictable for these Modells and there is so much influence that we cant calculate currently.When i read you blog, i see to much political and not much about physical and their mechanism, it makes me a bit sad.
Its easy to see, that the Modells are partly wrong, but its difficult to know why.
In my own research about influence from Sun to Earth-Temperature, results speaking clear language:
By no later than mid 1980, the sun have child-role in Earthclimate. All Parameter of sun and climate runs out off .Although, Sun-Radiation, Sunspots, Fluxes and AP-Index und this with integrated Timelag(10-15 years) between climate and sun. It have to be another reason which influcence climate and this warimung after mid 1980 is cleary caused by GHGs.
But now, i hope you understand why i dont you understand?
greets
Pingback: Preview of CMIP5/IPCC AR5 Global Surface Temperature Simulations and the HadCRUT4 Dataset | Bob Tisdale – Climate Observations
Pingback: Preview of CMIP5/IPCC AR5 Global Surface Temperature Simulations and the HadCRUT4 Dataset | Watts Up With That?