
MONTHLY SST ANOMALY MAP
The following is a Global map of Reynolds OI.v2 Sea Surface Temperature (SST) anomalies for April 2012. It was downloaded from the NOMADS website. The contour levels are set at 0.5 deg C, and white is set at zero.

April 2012 Sea Surface Temperature (SST) Anomalies Map
(Global SST Anomaly = +0.134 deg C)
MONTHLY OVERVIEW
With the ebbing of the 2011/12 La Niña, the Monthly NINO3.4 SST Anomaly rose as one would expect in April 2012 (about 0.167 deg C) to -0.30 deg C.
In response, Global Sea Surface Temperature anomalies have also increased. Both Hemispheres warmed. The only ocean basins to show cooling in April 2012 were the South Atlantic, North Pacific, and Arctic Ocean. The monthly Global Sea Surface Temperature anomalies are presently at +0.134 deg C.

(1) Global Sea Surface Temperature Anomalies
Monthly Change = +0.028 deg C
####################################

(2) NINO3.4 Sea Surface Temperature Anomalies
(5S-5N, 170W-120W)
Monthly Change = +0.167 deg C
####################################
THE EAST PACIFIC VERSUS THE REST OF THE WORLD
The East Pacific and the Rest-Of-The-World (Atlantic-Indian-West Pacific) datasets were first discussed in the post Sea Surface Temperature Anomalies – East Pacific Versus The Rest Of The World, and was discussed a few months later in How Can Things So Obvious Be Overlooked By The Climate Science Community?, and in my book If the IPCC was Selling Manmade Global Warming as a Product, Would the FTC Stop their deceptive Ads?.
In the following two graphs, both datasets have been adjusted for the impacts of volcanic aerosols. The global oceans were divided into these two subsets to illustrate two facts. First, the linear trend of the volcano-adjusted East Pacific (90S-90N, 180-80W) Sea Surface Temperature anomalies since the start of the Reynolds OI.v2 dataset is basically flat. The East Pacific linear trend varies with each monthly update. But it won’t vary significantly between El Niño and La Niña events.

(3) Volcano-Adjusted East Pacific Sea Surface Temperature (SST) Anomalies
(90S-90N, 180-80W)
####################################
And second, the volcano-adjusted Sea Surface Temperature anomalies for the Rest of the World (90S-90N, 80W-180) rise in very clear steps, in response to the significant 1986/87/88 and 1997/98 El Niño/La Niña events. It also appears as though the Sea Surface Temperature anomalies of this dataset are making another upward shift in response to the most recent ENSO event. For those who are interested in the actual trends of the Sea Surface Temperature anomalies between the 1986/87/88 and 1997/98 El Niño events and between the 1997/98 and 2009/10 El Niño events refer to Figure 4 in Does The Sea Surface Temperature Record Support The Hypothesis Of Anthropogenic Global Warming? I further described (at an introductory level) the ENSO-related processes that cause these upward steps in the post ENSO Indices Do Not Represent The Process Of ENSO Or Its Impact On Global Temperature.

(4) Volcano-Adjusted Sea Surface Temperature Anomalies For The Rest of the World
(90S-90N, 80W-180)
####################################
The periods used for the average Rest-Of-The-World Sea Surface Temperature anomalies between the significant El Niño events of 1982/83, 1986/87/88, 1997/98, and 2009/10 are determined as follows. Using the NOAA Oceanic Nino Index(ONI) for the official months of those El Niño events, I shifted (lagged) those El Niño periods by six months to accommodate the lag between NINO3.4 SST anomalies and the response of the Rest-Of-The-World Sea Surface Temperature anomalies, then deleted the Rest-Of-The-World data that corresponds to those significant El Niño events. I then averaged the Rest-Of-The-World SST anomalies between those El Niño-related gaps.
The “Nov 2010 to Present” average varies with each update. As noted in the post Sea Surface Temperature Anomalies – East Pacific Versus The Rest Of The World, it will be interesting to see where that Sea Surface Temperature anomaly average settles out, if it does, before the next significant El Niño drives them higher.
Of course, something could shift. Will the upward ratcheting continue when the Atlantic Multidecadal Oscillation (AMO) decides to turn around and start its decline? The upward steps would not continue in the North Atlantic, but would the AMO impact the upward steps in other portions of the globe? For more information about the Atlantic Multidecadal Oscillation, refer to the post An Introduction To ENSO, AMO, and PDO — Part 2.
The Sea Surface Temperature anomalies of the East Pacific Ocean, or approximately 33% of the surface area of the global oceans, have decreased slightly since 1982 based on the linear trend. And between upward shifts, the Sea Surface Temperature anomalies for the rest of the world (67% of the global ocean surface area) remain relatively flat. As discussed in my book, anthropogenic forcings are said to be responsible for most of the rise in global surface temperatures over this period, but the Sea Surface Temperature anomaly graphs of those two areas prompt a two-part question: Since 1982, what anthropogenic global warming processes would overlook the Sea Surface Temperatures of 33% of the global oceans and have an impact on the other 67% but only during the months of the significant El Niño events of 1986/87/88, 1997/98 and 2009/10?
STANDARD NOTE ABOUT THE DATA
The MONTHLY graphs illustrate raw monthly OI.v2 SEA SURFACE TEMPERATURE anomaly data from November 1981 to April 2012, as it is presented by the NOAA NOMADS website linked at the end of the post. I’ve added the 13-month running-average filter to smooth out the seasonal variations.
MONTHLY INDIVIDUAL OCEAN AND HEMISPHERIC SEA SURFACE TEMPERATURE UPDATES

(5) Northern Hemisphere Sea Surface Temperature (SST) Anomalies
Monthly Change = +0.034 deg C
####################################

(6) Southern Hemisphere Sea Surface Temperature (SST) Anomalies
Monthly Change = +0.023 deg C
####################################

(7) North Atlantic Sea Surface Temperature (SST) Anomalies
(0 to 70N, 80W to 0)
Monthly Change = +0.066 deg C
####################################

(8) South Atlantic Sea Surface Temperature (SST) Anomalies
(0 to 60S, 70W to 20E)
Monthly Change = -0.136 deg C
Note: I discussed the (now apparently temporary) upward shift in the South Atlantic Sea Surface Temperature anomalies in the post The 2009/10 Warming Of The South Atlantic. Prior to that shift, the South Atlantic sea surface temperature anomalies had been relatively flat for about two decades. It looks as though the South Atlantic sea surface temperature anomalies MAYreturn to the level they were at before that surge, and where they had been since the late 1980s. We’ll have to see where things settle.
####################################

(9) North Pacific Sea Surface Temperature (SST) Anomalies
(0 to 65N, 100E to 90W)
Monthly Change = -0.029 Deg C
####################################

(10) South Pacific Sea Surface Temperature (SST) Anomalies
(0 to 60S, 120E to 70W)
Monthly Change = +0.072 deg C
####################################

(11) Indian Ocean Sea Surface Temperature (SST) Anomalies
(60S to 30N, 20E to 120E)
Monthly Change = +0.048 deg C
####################################

(12) Arctic Ocean Sea Surface Temperature (SST) Anomalies
(65N to 90N)
Monthly Change = -0.038 deg C
####################################

(13) Southern Ocean Sea Surface Temperature (SST) Anomalies
(90S-60S)
Monthly Change = +0.056 deg C
####################################
WEEKLY SEA SURFACE TEMPERATURE ANOMALIES
The NINO3.4 Sea Surface Temperature anomalies based on the week centered on May 2, 2012 are still approaching zero. They are presently at -0.060 deg C.
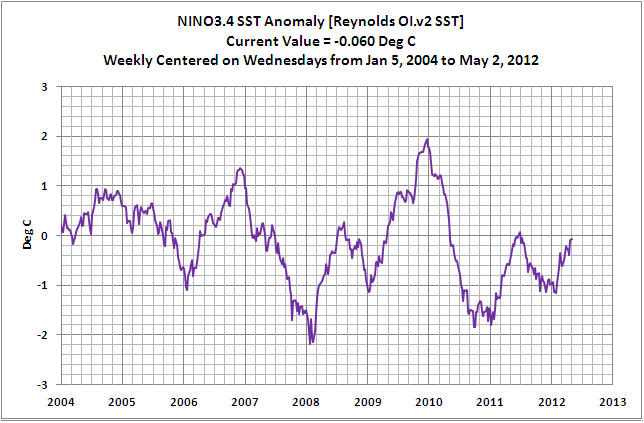
(14) Weekly NINO3.4 Sea Surface Temperature (SST) Anomalies
####################################
The weekly global Sea Surface Temperature anomalies are warming in response to the seasonal ENSO signal and are at +0.177 deg C. As I noted a couple of times over the last few months, even though this La Niña event was not as strong as the one that occurred last year, the ENSO-related minimum for the weekly global sea surface temperatures this year are noticeably lower than last.

(15) Weekly Global Sea Surface Temperature (SST) Anomalies
####################################
WOULD YOU LIKE TO UNDERSTAND WHY THE ATLANTIC-INDIAN-WEST PACIFIC DATASET SHIFTS UPWARD IN RESPONSE TO MAJOR EL NIÑO EVENTS?
Over the past three years, in so many posts it’s not practical to link them here, I’ve presented (discussed, illustrated, animated) the El Niño-Southern Oscillation (ENSO)-related processes that cause the blatantly obvious upward shifts in sea surface temperature anomalies for the Atlantic, Indian and West Pacific data shown above. I’ve also explained why the East Pacific shows no warming over the past 30 years. Please use the search function on this webpage to help find those posts.
Better yet, you could buy a copy of my book and save yourself some time. It is available in pdf and Kindle formats. See If the IPCC was Selling Manmade Global Warming as a Product, Would the FTC Stop their deceptive Ads? Amazon also provides a Kindle preview that runs from the introduction through a good portion of Section 2. That’s about the first 15% of the book. A copy of the introduction, table of contents, and closing can be found here.
Of course, donationsare welcome and gratefully accepted, because there’s no truth to the rumor that bloggers skeptical of anthropogenic climate change are supported by big oil. No truth at all.
SOURCE
The Reynolds Optimally Interpolated Sea Surface Temperature Data (OISST) are available through the NOAA National Operational Model Archive & Distribution System (NOMADS).


Inspired by your work here, I snooped around on the Reynolds sea surface temperature site to plot the data. I saw that you always separated the oceans basins hemi-spherically with north pacific and north atlantic extending from the equator to the arctic, 0-65 and 0-70, respectively. I was curious as to whether a smaller regions could be informative.
The winter extent of the arctic sea ice gets down to around 45 N and that midpoint split seemed to be a logical break point. So I plotted the “near arctic” 45-67 and “arctic” 67-90 to look at the trends. My arctic definition was a compromise of the 65 or 70 levels you use, since I was not confident in breaking the regions by longitudinal limits, I used the -180 to 180 defaults.
The results were interesting and you might consider doing some analysis in a similar fachion. The historic “near arctic” temperature rise precedes the arctic temperature rise and corresponds reasonably well with the sea ice loss trends. Both the near arctic and arctic annualized temperatures have been trending lower since about 2007. I was surprised to find that the current near arctic temperatures are below average, at levels last seen in 2000, and have dropped below the arctic anomolies for the first time in more than a decade.
If the historical rising temperature trend indicates a warm slug of ocean water heading north and causing multi-year melt of the sea ice until the heat was dissipated, does the current cold temperatures indicate a cold slug of water that will moderate the sea ice trend?
Thanks for letting me (us) know the outcome of your investigation, Crashex.
Mr. Tisdale, I do not agree that there will be another step up after the 2010 El Nino event (red in figure 4). I believe temperatures will settle to where they were before (brown) because the 2010 event was different from the previous steps up in that the El Nino event of 2010.
George, time will tell.
Bob,
Sorry OT but have you noticed a new OHC data set has appeared on KNMI Climate Explorer from the Met Office? It.s called UKMO EN3. It looks very different from NODA especially around late 70’s early 80’s. I don’t know if you’re paid up to the idea of the mid-70’s climate shift but….
Best of luck.
http://www.metoffice.gov.uk/hadobs/en3/
UKMO EN3 website
HR: Thanks for the heads up. The last time I was into the NODC OHC data the Met Office OHC data wasn’t there.
Pingback: UKMO EN3 Ocean Heat Content Anomaly Data Disappeared From The KNMI Climate Explorer As Suddenly As It Appeared | Bob Tisdale – Climate Observations