
About two weeks ago, blogger HR advised me that the KNMI Climate Explorer had added another Ocean Heat Content Anomaly dataset, one identified as UKMO EN3. That ocean heat content data was available at four depths: 0-400 meters, 0-700 meters, 0-1000 meters and 0-2000 meters. Curiously, there was no reference to the UKMO EN3 ocean heat content data on the KNMI Climate Explorer news page, but there was, and still is, a note that the UKMO EN3 ocean salinity content data was added on May 2, 2012.
The UKMO EN3 ocean heat content anomaly data disappeared from the Climate Explorer website as surprisingly as it appeared. Yesterday, Friday June 1, I wanted to add to the graphs I had already prepared for an introductory post on the dataset, but the UKMO EN3-based ocean heat content had been removed. The salinity data remains, however. The UKMO EN3 ocean heat content data was there on Thursday May 31, I downloaded tropical Pacific data that day, but it was gone the next.
According to the UKMO EN3 webpage, the sources for the dataset are the obsolete NODC World Ocean Database 2005 (It has been replaced by the NODC World Ocean Database 2009), the NODC Global Temperature and Salinity Profile Programme (GTSPP), ARGO, and the Arctic Synoptic Basin-wide Observations (ASBO) project. The reference paper for the UKMO EN3 data is Ingleby and Huddleston (2007) Quality control of ocean temperature and salinity profiles – historical and real-time data.
The current version of the UKMO EN3 data (EN3_v2a) is corrected for the fall rates of expendable bathythermograph (XBT) based on the 2008 Wijffels et al paper Changing expendable bathythermograph fall rates and their impact on estimates of thermosteric sea level rise. These were the same corrections applied to the NODC ocean heat content anomaly data when they released it with the Levitus et al (2009) paper Global ocean heat content 1955–2008 in light of recently revealed instrumentation problems. So one would expect the two datasets to be similar during the 1970s and 80s. The UKMO EN3 data is also corrected for known ARGO problems (sensor drift, bias, spikes, etc.) based on Guinehut et al (2009) paper On the use of satellite altimeter data in Argo quality control. Levitus et al (2009) don’t reference Guinehut et al (2009), but they do note the ARGO data was corrected. Note: As far as I can tell, the data corrections are in separate files at the UKMO website.
If we compare the global UKMO EN3 ocean heat content anomalies (0-700 meters) to the NODC data for the same depths, Figure 1, we can see that the UKMO data (that is no longer available through the KNMI Climate Explorer) had not been corrected. The very obvious difference is that the UKMO data still had the hump in the 1970s and 1980s. And that suggests that the UKMO OHC data also did not receive the ARGO-era corrections based on Guinehut et al (2009).

Figure 1
So, where does that leave us during the ARGO era? I included graphs of the ARGO-era UKMO EN3 global Ocean Heat Content data in my post Dana1981 at SkepticalScience Tries to Mislead His Readers? See Figures 2 and 3. Are they misleading?

Figure 2
HHHHHHHHHHHHHHHHHHHHH
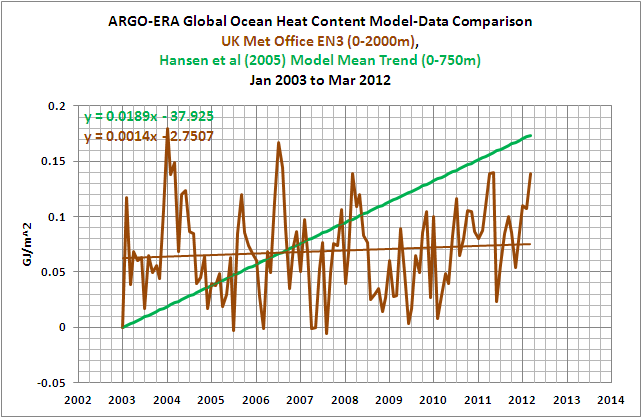
Figure 3
Not necessarily.
Figure 4 compares three ocean heat content anomaly datasets (0-700 meters) during the ARGO-era, from January 2003 to March 2010: the UKMO EN3 data and the NODC data before and after the modifications made in late 2010. The similarities between the early version of the NODC data and the uncorrected UKMO data may lead some to believe that the current version of the UKMO data would, if it had been available, resemble the revised NODC data. Unfortunately, the NODC made numerous changes to their ocean heat content anomaly data in 2010. I discussed the 2010 modifications to the NODC ocean heat content anomalies in the post Update And Changes To NODC Ocean Heat Content Data. The revisions to the NODC data were based on ongoing corrections to ARGO data. And the revisions were based on changes to the climatology used to calculate anomalies. And there were changes to the NODC OHC anomalies in 2010 due to additional XBT bias corrections. Refer to the NODC’s Notes on Changes to Heat Content Integrals between Levitus et al. (2009)* and September 2010 online version. And that leaves too many unknowns for us to say one way or the other that the ARGO corrections were responsible for the recent increase in the NODC ocean heat content data. So, for now, I will leave Figures 7 and 8 in my post Dana1981 at SkepticalScience Tries to Mislead His Readerswithout any notations. But I will add an update to the post, directing readers to this post.

Figure 4
I was very sorry to see KNMI remove the UKMO EN3 ocean heat content data from Climate Explorer. I had always wanted to investigate that hump by dividing the oceans into subsets to see whether the Wijffels et al (2008)-based corrections were heavy handed. In other words, did the XBT fall-rate corrections remove part of a decadal variation that could be explained by changes in natural factors.
For example, Figure 5 compares the UKMO EN3 ocean heat content anomalies for the North Pacific, north of 20N, to the sea level pressure anomalies for the western North Pacific, north of 30N. Both datasets have been smoothed with a 121-month filter. My thought was that changes in sea level pressure there might impact how ocean heat was distributed from the tropics to the extratropics. And there are enough similarities between the two datasets to make one wonder whether the Wijffels et al (2008)-based corrections removed part of a naturally caused decadal variation in the data. Unfortunately, that was as far as I was able to take those comparisons.

Figure 5
I did do something worthwhile while the UKMO EN3 data was available. I downloaded anomaly maps for depths of 0-2000 meters for an animation. As usual, the animation uses maps of 12-month average anomalies that progress monthly. The 12-month averages are used to minimize any seasonal component and noise. Animation 1 starts with the 12-month period of January to December 1996 and runs through the 12-month period of April 2011 to March 2012. I enjoy watching how ENSO impacts different variables, such as how and where leftover ocean heat content anomalies from the 1997/98 El Niño was “recycled” for the secondary El Niño events in 2002/03, 2004/05 and 2006/07. Such as how ENSO-related ocean heat content anomalies work their way from the tropics toward the poles. You may have to click on the animation to get it to show.

Animation 1
Well, that’s the story about the short-lived UKMO Ocean Heat Content data at the KNMI Climate Explorer. Sorry that KNMI felt obligated to remove it. It would have been an interesting dataset to investigate. I won’t speculate as to why it was removed. But you can.


Pingback: Dana1981 at SkepticalScience Tries to Mislead His Readers | Bob Tisdale – Climate Observations
Hi Bob,
The UKMO dataset was more consistent with the now defunct ENVISAT sea level series. The NODC OHC dataset is more consistent with the Colorado sea level series. Go figure.
I think the real problem is that these indices are being calibrated to hypotheses rather than any actual measurable reality. Does anyone believe that we know the position of the altimetry satellites in space to within a few millimetres? As for the endless ARGO adjustments, this is the fudging of data to fit the theory. Plus the big upward step at the splice with XBT data is demonstrably wrong using CERES flashflux data.
Red hot lies. We are being conned.
Pingback: Where’s The Anthropogenic Global Warming Signal in the NODC Ocean Heat Content Data (0-700Meters)? | Bob Tisdale – Climate Observations
Pingback: Where’s The Anthropogenic Global Warming Signal in the NODC Ocean Heat Content Data (0-700Meters)? « The Real World
Pingback: Tisdale: Where’s The Anthropogenic Global Warming Signal in the NODC Ocean Heat Content Data (0-700Meters)? | Watts Up With That?
I have been reading more of your links from WUWT and reading them here! Thank you again Bob.
And thank you for your interest, Susan S.
Pingback: Is Ocean Heat Content Data All It’s Stacked Up to Be? | Bob Tisdale – Climate Observations
Pingback: Is Ocean Heat Content Data All It’s Stacked Up to Be? | Watts Up With That?
Pingback: Ocean Heat Content (0 to 2000 Meters) – Why Aren’t Northern Hemisphere Oceans Warming During the ARGO Era? | Bob Tisdale – Climate Observations
Pingback: Ocean Heat Content (0 to 2000 Meters) – Why Aren’t Northern Hemisphere Oceans Warming During the ARGO Era? | Watts Up With That?
Bob – do you have a link to the actual data used in Figure 2?
Joseph: The NODC ocean heat content is available through the KNMI Climate Explorer:
http://climexp.knmi.nl/selectfield_obs.cgi?someone@somewhere
The UKMO EN3 data was unfortunately removed from the KNMI Climate Explorer as discussed in the post.
Regards
Pingback: Reactions to ‘The pause’: Grasping at strawmen in hidey holes | Watts Up With That?
Pingback: Il prossimo global warming? Sulla Luna! | Climatemonitor
Pingback: Comments on Stefan Rahmstorf’s Post at RealClimate “What ocean heating reveals about global warming” | Bob Tisdale – Climate Observations
Pingback: Comments on Stefan Rahmstorf’s Post at RealClimate “What ocean heating reveals about global warming” | Watts Up With That?
Pingback: Le hiatus : à la recherche de la chaleur perdue… | A PROPOS DU CLIMAT
Pingback: New Paper Tries to Explain Disparities in Deep Ocean Warming Between Two Basins | Bob Tisdale – Climate Observations
Pingback: New Paper Tries to Explain Disparities in Deep Ocean Warming Between Two Basins | Watts Up With That?