
UPDATE 4 (February 13, 2013): I had used the weekly sea surface temperature data of the week centered on January 30th for the map in Figure 1 and for the time-series graph in Figure 2 in this post. Those sea surface temperatures were well before Nemo made its way across the Atlantic coastal waters, heading toward New England. I’ve updated those two illustrations for the week of February 6th here.
UPDATE 3: Joe Romm quoted Kevin Trenberth in a post at ClimateProgress:
The moisture flow into the storm is also important and that is enhanced by higher than normal sea surface temperatures (SSTs). These are higher by about 1 deg C [almost 2°F] than a normal (pre-1980) due to global warming and so that adds about 10% to the potential for a big snow.
Kevin Trenberth must not have bothered to look at long-term sea surface temperature data. Sea surface temperatures off the coast of New England were much warmer in the 1940s. Maybe someday Trenberth will explain how the cooler current sea surface temperatures are a sign of manmade global warming. (Thanks, Henry.)
UPDATE 2: It appears ClimateCentral has also failed to check the data before making bogus claims about the effects of manmade global warming on the sea surface temperatures of New England Coastal waters. (Thanks to Anthony Watts who introduced it in his cross post.)
UPDATE: If you should run into any alarmists over the next couple of days, remind them of the Northeast Blizzard of 1978.
########################
This is a preliminary report. Sea surface temperature data for the week centered on Wednesday February 6, 2013 will not be available until Monday February 11. I’ll be happy to update this post then.
Global warming alarmists are predictable. If they see elevated sea surface temperature anomalies on a map anywhere close to a weather event, they immediately claim manmade global warming contributed, or will contribute, to the weather. They erred that way with Hurricane Sandy—sea surface temperatures along Sandy’s storm track haven’t warmed in 70+ years—and they’ve done it again with the blizzard threatening New England today. Refer to the WattsUpWithThat post Propagandist Brad Johnson of ‘Forecast the Facts’ tries to make the pending East Coast blizzard about the ocean ‘warming’ – Fails.
Anyone who has followed my posts over the past 4 years about the natural warming of satellite-era sea surface temperatures understands there is nothing in the data to indicate that manmade greenhouse gases played any part in the warming. That is, the data indicates Mother Nature, not manmade greenhouse gases, was responsible for the warming over the past 31 years. The same holds true for ocean heat content data.
Figure 1 is a map of the sea surface temperature anomalies (Reynolds OI.v2) for a portion of the North Atlantic. It captures the data for the week centered on Wednesday January 30, 2013. The map was created at the NOAA NOMADS website, using the Reynolds Optimum Interpolation sea surface temperature data. I’ve used the contour levels of 0.5 deg C, with white set at zero, which are settings often used by NOAA. Obviously, last week sea surface temperature anomalies were elevated near the New England coast, but the data, as we will see, reveals that there’s nothing unusual about those levels. We’ll use the coordinates of 35N-45N, 77W-67W for the data in the following graphs.

Figure 1
SHORT-TERM WEEKLY DATA
Figure 2 presents the weekly sea surface temperature anomalies off the New England coast, starting with the week centered on Wednesday January 3, 1990 and ending with the week of January 30, 2013. The base years for anomalies are the standard climatology of 1971-2000 from the NOAA NOMADS website. The horizontal red line represents the most recent weekly value of +0.55 deg C. Sure does look like it’s been warmer many times over the past 2+ decades.

Figure 2
LONG-TERM MONTHLY DATA
We have to switch datasets to NOAA’s ERSST.v3b for the long-term data. The data for the month of February 2013 will not be available until early in March, so we’ll use the January 2013 value for the most recent temperature anomaly for the New England coastal waters—the red horizontal line. The current anomalies were exceeded by a good amount in the 1940s. And they’ve regularly been exceeded as far back as the 1850s and 60s.

Figure 3
And to drive the point home, Figure 4 is a graph of the January sea surface temperatures (not anomalies) for the New England coastal waters from 1854 to 2013. Sea surface temperatures were much warmer during the 1930s and 40s.
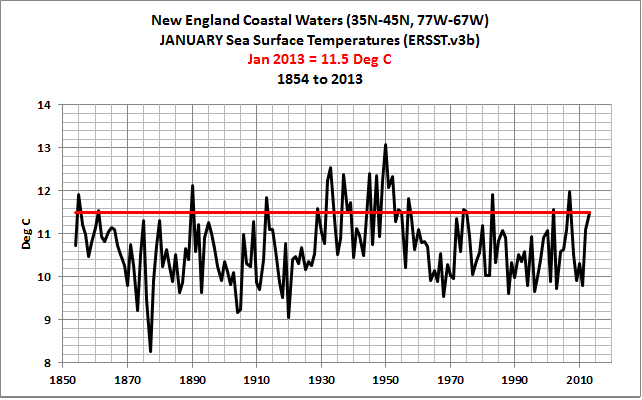
Figure 4
CLOSING
It’s difficult to claim the recent increases in manmade greenhouse gases are responsible for the warm sea surface temperatures off the New England coast, when the those values were regularly exceeded 70 to 80 years ago.
Alarmists will take any opportunity to claim manmade greenhouse gases are responsible for weather events, such as Hurricane Sandy, and now the upcoming New England Blizzard. It’s often easy to illustrate the errors in their claims. Another example is the Russian heat wave of 2010 which Trenberth and Fasullo tried (and failed) to attribute to the warming of sea surface temperatures. Refer to the post here.
Alarmists, of course, will continue to make unfounded claims, and I will be happy to show how ridiculous those claims are.
SOURCES
The weekly Reynolds OI.v2 dataset is available through the NOAA NOMADS website. And the ERSST.v3b dataset can be accessed through the KNMI Climate Explorer.
DATA REVEAL THE OCEANS WARMED NATURALLY
Earlier I noted that satellite-era sea surface temperature data indicate the oceans warmed naturally, not via manmade greenhouse gases. NOAA’s ocean heat content data also do not support the hypothesis of manmade global warming. Refer to my recent essay titled “The Manmade Global Warming Challenge”, which is linked to my blog post here. Refer also to the two-part video series prepared for the WattsUpWithThat (WUWT-TV) special linked to the post The Natural Warming of the Global Oceans. And of course there’s my book Who Turned on the Heat?
Who Turned on the Heat? is intended for persons (with or without technical backgrounds) interested in learning about El Niño and La Niña events and in understanding the natural causes of the warming of our global oceans for the past 31 years. Because land surface air temperatures simply exaggerate the natural warming of the global oceans over annual and multidecadal time periods, the vast majority of the warming taking place on land is natural as well. The book is the product of years of research of the satellite-era sea surface temperature data and ocean heat content data that are available to the public via the internet. It presents how the data accounts for its warming—and there are no indications the warming was caused by manmade greenhouse gases. None at all.
Who Turned on the Heat? was introduced in the blog post Everything You Ever Wanted to Know about El Niño and La Niña… …Well Just about Everything. The Updated Free Preview includes the Table of Contents; the Introduction; the beginning of Section 1, with the cartoon-like illustrations; the discussion About the Cover; and the Closing.
Please buy a copy. Credit/Debit Card through PayPal. You do NOT need to open a PayPal account. Simply scroll down to the “Don’t Have a PayPal Account” purchase option. It’s only US$8.00.


Bob, slightly different subject but same theme (the journalistic knee-jerk to blame anything on sea temp), an article in the Financial Times today says, “The price of fishmeal has surged to a record high because of a dramatic decline in the number of anchovies harvested off the coast of Latin America, their main feeding ground, partly due to rising sea temperatures.” Have those temps risen in past couple of years? (I think the real reason is that fishmeal competes with soymeal, which has been driven up by the US drought.)
Bill Hudson, the authors aren’t very specific with their claim, are they? They don’t state where along the coast of Latin America and they’ve included the weasle words “partly due”. As a whole, the sea surface temperatures of the East Pacific Ocean haven’t warmed in 31 years:

Bob, the article says, “Peru, a leading exporter of the commodity, slashed the commercial fishing quota of anchovies 70 per cent in the last three months.”
Bill Hudson, sea surface temperature anomalies along the coast of Peru, like the east Pacific as a whole, have not warmed in 31 years:

I may write that up as a full post in a couple of days, after I clean up the typo in the.heading.
Regards
Bob, here’s a link to the Peru quota action.
http://en.mercopress.com/2012/11/04/peru-slashes-anchovy-quota-by-68-fish-meal-prices-forecasted-to-soar
As we know, the anchovy catch was/is a historical market of El Nino.
Will watch for your post.
Maybe these people should go back and read about the blizzard of 1888 in the same area with similar conditions.
http://en.wikipedia.org/wiki/Great_Blizzard_of_1888
@Bill Hudson: the current trade wind anomalies don’t look favorable for El Nino development to me right now but then they don’t look favorable for a strong La Nina, either. Right now conditions would seem to me to point to a more or less neutral condition to weak La Nina at least for the rest of February. The waters off Peru are still rather cold with sea surface temperatures over 2 degrees below normal around the Galapagos. They are attributing this fall off in catch to overfishing, not a change in ocean conditions. The global demand for fish oil (Omega 3 supplements) and pet food (fish meal) is putting pressure on the industry to increase catches. The El Nino related collapses of the catch when the fish migrated due to changes in ocean temperatures happened during the previous El Ninos when the temperatures had already risen. That isn’t the case right now. The waters are still rather cool there. This does tend to look more like a case of overfishing.
http://latino.foxnews.com/latino/news/2013/02/05/anchovy-overfishing-in-peru-raising-concerns/
Bob, if you get the chance, an analysis of two grid cells might be instructive. There’s evidence that Long Island sound and the southern New England bays have warmed — local measurements, ecosystem changes, etc. The Gulf of Maine is under the influence of colder currents from the north and may not have changed (as much). Like politics, climate perception is local. Not that you’re wrong in your refutation of the claims of the chicken-littles, but this analysis may be averaging too large an area for what people experience and react to in their back yards.
Gary: If you provide the coordinates, I’ll provide the graphs.
Bob, given the variable nature of the SSTs and the often warmer than now temps seen in the long-term records you show, do you think Trenberth’s reference to ‘normal’ is:
a) unscientific
b) a weasel word
c) meant to deceive an unquestioning audience
d) all of the above?
It appears that many in the AGW camp have the idea that balmy weather at just the right temperature for wherever they live is ‘normal’ and anything outside of this is caused by AGW.
The only thing normal about weather is that variation is the norm.
John (in Oz): Electric power is intermittent here, so I have to make this short. To me, when Trenberh is referring to “normal”, he’s simply referring to base years used for anomalies. He mentioned something about 1980 in his comment, and I’ve used the base years of 1971-2000. Against the base years of 1971-2000, sea surface temperatures in January were 0.9 deg C above the average or “normal” for those base years.
Regards
Great analysis. This article also looks at temperature data and finds a fairly weak case for global warming. http://www.statisticsblog.com/2012/12/the-surprisingly-weak-case-for-global-warming/
Bob, how about 36-41N by 70-75W for the southern New England grid cell and the 41-46N by 65-70W for the Gulf of Maine. These are equivalent, non-overlapping 5-degree cells and represent what marine ecologists have recognized for well over a century as two different current and temperature regimes that meet at Cape Cod, Massachusetts. I’m curious if the two have behaved in lockstep or not.
Sorry for the delay in responding to your kind offer to run this. 18 inches of “climate disruption” took me off-line for a couple of days.
Gary: Here ya go. They’re a little out of synch. The Gulf of Maine doesn’t appear to have gotten word yet from the AO that it’s okay to cool down a little. Then again, we’re looking at awfully small grids. In general, they follow the larger grid I used.


South of New England short term:
South of New England long term:
Gulf of Maine short term:
Gulf of Maine long term:
I just saw that NYC, Long Island and Southern CT can expect another 6 inches of snow in a couple of days. Have fun.
Bob,
I’ve been having some very peculiar problems with my computer while surfing your site. Have the opposition been attempting to send a virus your way? Every link I try to open sends my computer into a tail spin. Just an FYI
Still enjoying Who turned on the heat…
Michael
Michael Boice: Please let me know which links that are giving you problems–examples.
Pingback: Video: The Impact of Manmade Global Warming on a Blizzard Called Nemo and on Hurricane Sandy | Bob Tisdale – Climate Observations
Many thanks, Bob. I’ll study these plots a bit and get back to you.
They’re telling us there may be some “accumulation” a couple of times in the next week. Temps are near freezing so it depends on the storm track.
Pingback: Update for “Blizzard Called Nemo” Post About Sea Surface Temperature Off Coast of New England | Bob Tisdale – Climate Observations
http://www.news24.com/Green/News/Climate-change-is-real-experts-say-20130213
Pingback: New video from Bob Tisdale explains The Impact of Manmade Global Warming on a Blizzard Called Nemo and on Hurricane Sandy | Watts Up With That?
Pingback: Blog Memo to Lead Authors of NCADAC Climate Assessment Report | Bob Tisdale – Climate Observations
Pingback: Blog Memo to Lead Authors of NCADAC Climate Assessment Report | Watts Up With That?