
Or In a Discussion of the Hiatus Since 1998, Grant Foster Presents Trends from 1970 to 2010, Go Figure!
Statistician Grant Foster (a.k.a. blogger Tamino, who also likes to call himself Hansen’s Bulldog) is back to his one of his old debate tactics again: redirection. Or maybe a squirrel passed by and, like Dug the talking dog from Pixar’s Up, Hansen’s Bulldog simply lost track of the topic at hand.
For some reason, Grant Foster wants to keep drawing attention to the fact that the night marine air temperature data that NOAA used as a reference do not support the changes NOAA made to their sea surface temperature data…and I am more than happy to discuss this topic yet another time.
BACKSTORY – THE EXCHANGE
Grant Foster didn’t like my descriptions of the new NOAA ERSST.v4-based global surface temperature products in my post Both NOAA and GISS Have Switched to NOAA’s Overcooked “Pause-Busting” Sea Surface Temperature Data for Their Global Temperature Products. So he complained about them in his post New GISS data. His rant began:
Of course, deniers are frothing at the mouth about the change. The “hit man” for WUWT, Bob Tisdale has been insulting it as much as he can. He keeps saying things like “Overcooked “Pause-Busting” Sea Surface Temperature Data” and “unjustifiable, overcooked adjustments presented in Karl et al. (2015)” and “magically warmed data.”
And Grant Foster didn’t like that I presented the revised UAH lower troposphere data in a positive light.
I responded to Grant Foster’s complaints (a.k.a. Hansen’s Bulldog’s whines) with the post Fundamental Differences between the NOAA and UAH Global Temperature Updates. The bottom line of it was:
The changes to the UAH dataset can obviously be justified, while the changes to the NOAA data obviously cannot be.
I even reminded readers that the topic of discussion was the slowdown in global surface warming, or the hiatus.
Refering to another topic in Tamino’s post, I wonder if Tamino would prefer the term “hiatus busting” instead of “pause busting”, considering that Karl et al (2015) used the term hiatus, not pause, in the title of their paper Possible artifacts of data biases in the recent global surface warming hiatus. Mmm, probably not, because Tamino uses the same misdirection as NOAA did in Karl et al.
THAT LEADS US TO THE TOPIC OF THIS POST
Obviously, Grant Foster missed that paragraph about the hiatus, the pause, the slowdown, whatever you want to call it…or Hansen’s Bulldog got sidetracked by a squirrel, because he replied with the post Fundamental Differences between Bob Tisdale and Reality.
Grant Foster started with my comparison graph of the new ERSST.v4 data and the HADNMAT2 data, which served as a reference for the ERSST.v4 data. See Figure 1.
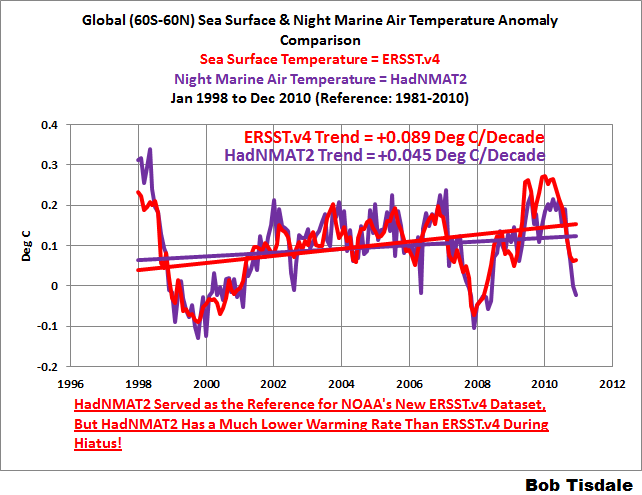
Figure 1
The data clearly show that NOAA cannot justify the excessive warming rate during the global warming slowdown because the warming rate of the NOAA data is far higher than the dataset they used as reference. Yet Grant Foster included that graph in his post.
Note: If you’re wondering why the data in the graph ends in 2010, that’s the last year of the HADNMAT2 data at the KNMI Climate Explorer. We’ll address the start year of 1998 in a moment. [End note.]
Foster did not dispute my trend presentation; he simply replicated my graph (without the trends) in the first of his three graphs, which I’ve included as the top cell of my Figure 2. Then Grant Foster switched topics (timeframes) and presented two graphs that began in 1970, which I’ve included as Cells B & C of Figure 2.

Figure 2
About his 2nd and 3rd graphs (Cells B & C), Grant Foster writes (my boldface):
That certainly destroys the impression from Bob’s cherry-picked graph. But wait — is the NMAT trend estimate “much lower” and the ERSSTv4 trend estimate “much higher”? Well, that from NMAT is 0.0116 deg.C/yr, from ERSSTv4 it’s 0.0117 deg.C/yr. [sarcasm] Big difference! [\sarcasm]
“Cherry-picked?” How silly can Grant Foster get?!!! The topic at hand is the hiatus as described by Karl et al., not the trends starting in 1970. Only Grant (and his followers) are interested in the trends from 1970 to 2010.
And what was one of the years that Karl et al. used for the start of the slowdown in global surface warming?
Grant Foster failed to tell his readers that Karl et al. used 1998 as the start year for many of their trend comparisons. I’ve circled them on Figure 1 from Karl et al., which is included as my Figure 3. For the oceans, Karl et al. compared their “new” ERSST.v4 data to their “old” ERSST.v3b data.
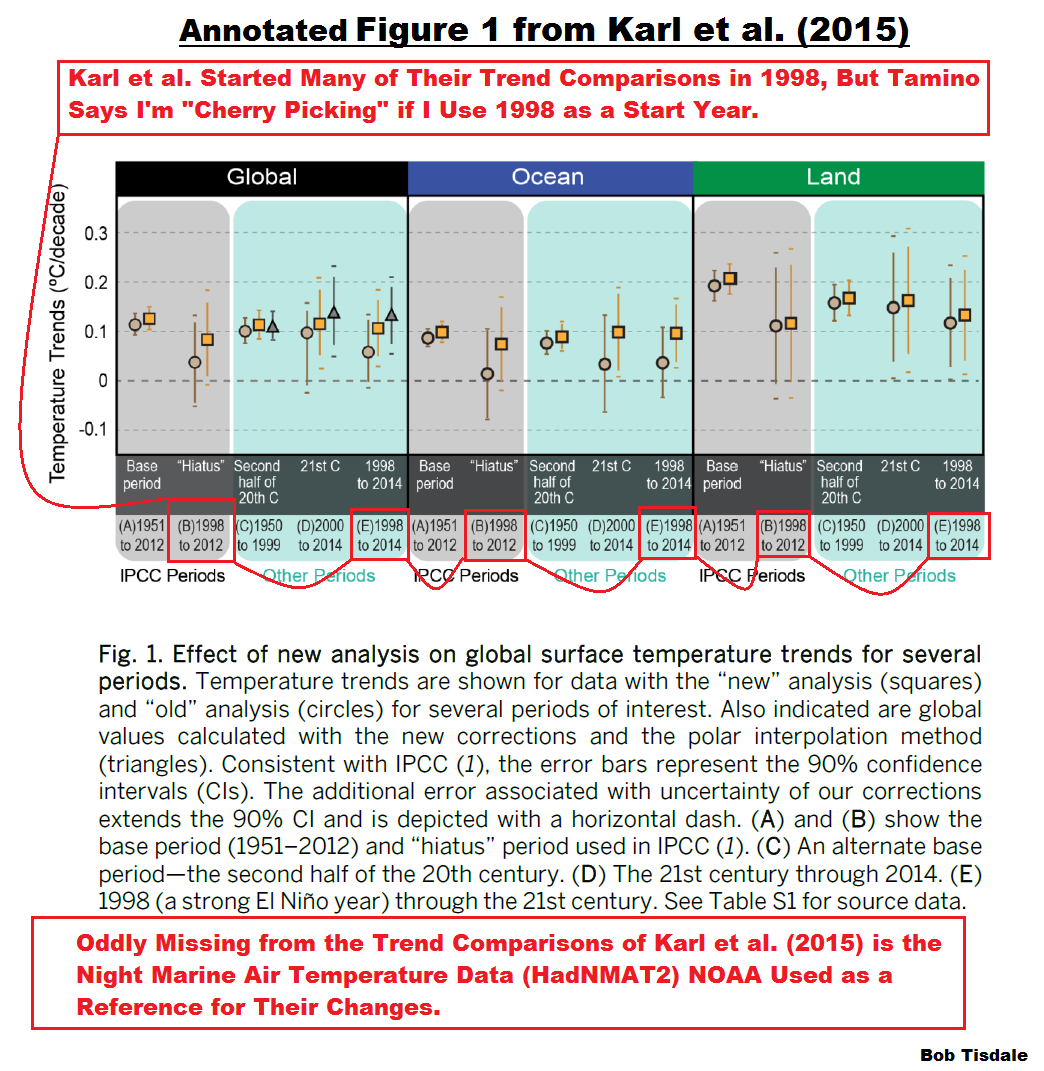
Figure 3
Also see the note at the bottom of Figure 3. One of the bases for the following two posts was the failure of Karl et al. to include trend comparisons of their new (overcooked) sea surface temperature dataset and the night marine air temperature dataset they used as a reference for their changes:
- More Curiosities about NOAA’s New “Pause Busting” Sea Surface Temperature Dataset, and,
- Open Letter to Tom Karl of NOAA/NCEI Regarding “Hiatus Busting” Paper
And I introduced Figure 1 in the latter of those two posts.
CLOSING
Hansen’s Bulldog (Grant Foster, a.k.a. Tamino) chooses to mislead his readers by ignoring the fact that Karl et al. used the start year of 1998 for many of their short-term trend comparisons, thereby making him look foolish when he claims that I’ve cherry-picked 1998 as the start year for my comparison. Anyone who read and understood Karl et al. (2015) can see the obvious failure in Tamino’s silly attempt at redirection.
Grant Foster did not dispute the trends listed on my Figure 1, which he included in his post.
Those trends showed, for the period of 1998 (a start year used by Karl et al. for trend comparisons) to 2010 (the end year of the HADNMAT2 data), that NOAA’s new ERSST.v4 sea surface temperature dataset had a much higher warming rate than the HADNMAT2 data, which NOAA used as reference for their adjustments.
In other words, NOAA overcooked the adjustments to their new ERSST.v4 data, which serve as the ocean component of the GISS and NCEI (formerly NCDC) global land+ocean surface temperature products.
Once again I have to thank Grant Foster (a.k.a. Tamino and Hansen’s Bulldog) for yet another opportunity to show that NOAA cannot justify the relatively high warming rate of their new ERSST.v4 sea surface temperature data during the hiatus, because it far exceeds the trend of the HadNMAT2 data that NOAA used as a reference.


Pingback: Tamino (Grant Foster) is Back at His Old Tricks…That Everyone (But His Followers) Can See Through - Perot Report
Thanks, Bob.
It is silly of Tamino not to address your proposition. It might taken that he can’t.
Pingback: Yet Even More Nonsense from Grant Foster (Tamino) et al. on the Bias Adjustments in the New NOAA Pause-Buster Sea Surface Temperature Dataset | Bob Tisdale – Climate Observations
Pingback: Yet Even More Nonsense from Grant Foster (Tamino) et al. on the Bias Adjustments in the New NOAA Pause-Buster Sea Surface Temperature Dataset | Watts Up With That?