
This may seem like an unusual time to have this discussion. We’re presently in ENSO (El Niño-Southern Oscillation)-neutral conditions, meaning the tropical Pacific isn’t experiencing an El Niño or a La Niña. And based on the ENSO-forecasting models, NOAA says “ENSO-neutral is expected into the Northern Hemisphere spring 2014”. (See the NOAA weekly ENSO Update.)
But the question “what initiates an El Niño?” was raised again recently on the thread of a blog post at WattsUpWithThat, so I thought I’d bring the answer forward as a post.
This post includes 2 chapters of my book Who Turned on the Heat? The first is the basic discussion of the transition from ENSO-neutral conditions to El Niño (Chapter 3.5). I’m providing it for people who aren’t too familiar with the fundamental processes that take place during the evolution of El Niño events. The second chapter included in this post is the discussion of what initiates an El Niño beyond my usual basic description of “a weakening of the trade winds” (Chapter 4.15). There are many other topics discussed in Who Turned on the Heat? See the Table of Contents in the Free Preview.
# # #
3.5 The Transition from ENSO-Neutral to El Niño
While the tropical Pacific is in the ENSO-neutral phase, the trade winds push the warm water to the west so that sea level there is higher than it is in the east. The sea level would like to be the same height because of gravity, but the trade winds are holding all of that warm water in place. The trade winds are being reinforced by the warmer sea surface temperatures in the western tropical Pacific. Similarly, the warmer waters in the western tropical Pacific are being reinforced by the trade winds. They are providing positive feedback to one another (Bjerknes feedback). With the positive feedback, the tropical Pacific would tend to stay in the ENSO-neutral mode. Something has to force things to change.
The trade winds in the western Pacific are, like all winds, quite variable. They strengthen and weaken with changes in weather. The size and shape of the Pacific Warm Pool varies in response. However, under “normal” conditions, the trade winds continue to hold the warm water in the western tropical Pacific.
Suppose the trade winds were to weaken to the point, and weaken long enough, that they could no longer hold the warm water in place in the west Pacific Warm Pool. The water would slosh to the east.
That’s how an El Niño event starts. Figure 3-10 shows the ENSO-neutral conditions changing to El Niño.

As shown in Figure 3-10, the Equatorial Countercurrent in the Pacific carries the warm water eastward. Normally, it’s a relatively small current compared to the North and South Equatorial Currents, but during an El Niño, the Pacific Equatorial Countercurrent becomes much larger. See Figure 3-11.
Figure 3-11 presents maps that show the direction of the currents in the central portion of the tropical Pacific. The eastward-flowing Equatorial Countercurrent is shown in dark blue. The westward-flowing North and South Equatorial Currents are shown in the off-color green. The top map shows the relatively small Equatorial Countercurrent in December 1996, which was an ENSO-neutral month. The bottom map shows that it’s much larger near the peak of the 1997/98 El Niño in December 1997. The maps are available through the NASA Ocean Motion website, at their OSCAR webpage.

A couple of years ago, I used those maps of the tropical Pacific Ocean currents to create a series of animations that I presented on YouTube. The animations capture the strengthening of the Equatorial Countercurrent during the transition from ENSO-neutral phase to the 1997/98 El Niño phase and its subsequent weakening as the El Niño event transitions back toward ENSO-neutral. Because there are multiple animations showing different portions of the tropical Pacific, I’ll refer you to the post Equatorial Currents Before, During, and After The 1997/98 El Niño.
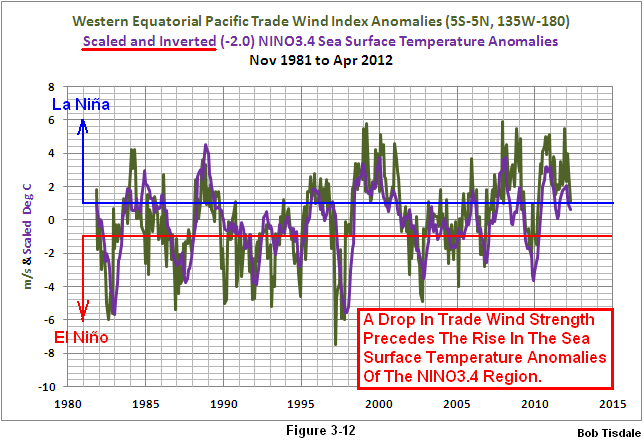
Figure 3-12 compares two ENSO-related variables: western equatorial Pacific trade wind strength and NINO3.4 sea surface temperature anomalies, our ENSO index. The NINO3.4 sea surface temperature anomalies have been scaled and inverted (multiplied by a scaling factor of -2.0) so that the variations in both datasets are in the same direction. That is, the El Niño events are now the large downward spikes. The western equatorial Pacific trade wind data is from the NOAA/Climate Prediction Center Monthly Atmospheric & SST Indices webpage. There it’s identified as “850 mb Trade Wind Index (135°East-180°West) 5°North-5°South West Pacific”. The Trade Wind Index data presented in the graph are the anomalies, which are the second group here. As illustrated, the El Niño events are preceded by significant drops in western equatorial Pacific trade wind strength.
 RECAP
RECAP
In Figure 3-11, we confirmed that the Equatorial Countercurrent enlarges during an El Niño, carrying the warm water from the Pacific Warm Pool eastward. The dark green curve of the trade wind anomalies leads the sea surface temperature in Figure 3-12. This confirms that a weakening of the trade winds in the western tropical Pacific happens a number of months before the NINO3.4 sea surface temperature anomalies register the El Niño event. In other words, it takes a couple of months after the weakening of the west Pacific trade winds for the enlarged Equatorial Countercurrent to carry the warm water east so that it warms the sea surface temperatures of the NINO3.4 region.
We’ll expand on this discussion, introducing a phenomenon called a Kelvin wave, in “Chapter 4.8 Subsurface Temperature and Temperature Anomaly Variations in the Equatorial Pacific And an Introduction to Kelvin Waves” [not included with this blog post].
# # #
4.15 Further Discussion on What Initiates an ENSO Event
When Anthony Watts cross posts one of my blog posts about ENSO at his widely read blog WattsUpWithThat, a question that’s often asked is “What initiates an El Niño?” My reply is typically something to the effect of: An El Niño event is initiated by a weakening of the tropical Pacific trade winds. This allows the warm water that had been held in place in the west Pacific Warm Pool to slosh east.
Sometimes there’s the follow-up question “What causes the trade winds to relax?” My usual reply is: There are a number of causes and they vary.
This doesn’t satisfy some people who are looking for a single definite answer, but, unfortunately, it’s true. There are numerous scientific papers that discuss this fact. In this chapter, we’ll present relatively simple descriptions of the many factors that cause the relaxing of the trade winds.
A phenomenon known as a Westerly Wind Burst (WWB), also known as a Westerly Wind Event (WWE), accompanies the relaxed trade winds. If you wanted to investigate this further, those would be the phrases to use in your searches. There are multiple causes of Westerly Wind Bursts, including:
1. Cross-equatorial tropical cyclones in the western tropical Pacific. This refers to a time when one tropical cyclone exists north of the equator in the western tropical Pacific, while, at the same time, another tropical cyclone exists there but south of the equator. The tropical cyclone winds in the Northern Hemisphere rotate counterclockwise and in the Southern Hemisphere they’re clockwise. Between them, the winds would be traveling from east to west west to east. These are discussed in Keen (1982) The Role of Cross-Equatorial Tropical Cyclone Pairs in the Southern Oscillation.
2. A single cyclone and series of cyclones in the western tropical Pacific. These are discussed in Hartten (1996) Synoptic settings of westerly wind bursts.
3. Cold surges from mid-latitudes, discussed in Harrison (1984) The appearance of sustained equatorial surface westerlies during the 1982 pacific warm event
4. Convective cloud clusters associated with the Madden–Julian oscillation (MJO). Refer to Zhang (1995) Atmospheric Intraseasonal Variability at the Surface in the Tropical Western Pacific Ocean.
As noted earlier, there are a plethora of other papers that discuss these factors. There is a good overall discussion in Vecchi and Harrison (2000) Tropical Pacific Sea Surface Temperature Anomalies, El Niño, and Equatorial Westerly Wind Events.
Then, after you’ve digested all of the factors that can trigger El Niño events, there’s a study that could shift your understanding once again. The paper is Yu et al (2003) Case analysis of a role of ENSO in regulating the generation of westerly wind bursts in the Western Equatorial Pacific. Yup, you read that title correctly. Yu et al (2003) found that ENSO can create favorable background conditions for westerly wind bursts. In other words, ENSO has the built-in ability to trigger itself.
RECAP
El Niño events are initiated by the relaxation of the trade winds associated with a single or a series of Westerly Wind Bursts in the western tropical Pacific. The causes of Westerly Wind Bursts are tropical cyclones (individual, multiple, and cross equatorial), cold surges from the mid-latitudes, and convection associated with the Madden–Julian oscillation (MJO), or a combination of them. To complicate things, there are indications that ENSO can create the background conditions that promote Westerly Wind Bursts.
[End of reprints from Who Turned on the Heat?]
Something to ponder before you argue that ENSO can’t create the conditions that help to initiate an El Niño, consider that Yu et al (2003) are considering low-frequency ENSO-neutral conditions to be a part of ENSO.
INTERESTED IN LEARNING MORE ABOUT THE EL NIÑO AND LA NIÑA AND THEIR LONG-TERM EFFECTS ON GLOBAL SEA SURFACE TEMPERATURES?
Why should you be interested? Sea surface temperature records indicate El Niño and La Niña events are responsible for the warming of global sea surface temperature anomalies over the past 31+ years, not manmade greenhouse gases. I’ve searched sea surface temperature records for more than 5 years now, and I’ve searched ocean heat content records for more than 4 years, and I can find no evidence of an anthropogenic greenhouse gas signal. That is, the data indicates the warming of the global oceans has been caused by Mother Nature, not anthropogenic greenhouse gases.
For a further discussion, see the essay (pdf) titled The Manmade Global Warming Challenge. (It’s 42MB, but it’s free and worth the download time.)
Last year, I published my e-book (pdf) about the phenomena called El Niño and La Niña. It’s titled Who Turned on the Heat? with the subtitle The Unsuspected Global Warming Culprit, El Niño Southern Oscillation. It is intended for persons (with or without technical backgrounds) interested in learning about El Niño and La Niña events and in understanding the natural causes of the warming of our global oceans for the past 30 years. Because land surface air temperatures simply exaggerate the natural warming of the global oceans over annual and multidecadal time periods, the vast majority of the warming taking place on land is natural as well. The book is the product of years of research of the satellite-era sea surface temperature data that’s available to the public via the internet. It presents how the data accounts for its warming—and there are no indications the warming was caused by manmade greenhouse gases. None at all.
Who Turned on the Heat? was introduced in the blog post “Everything You Ever Wanted to Know about El Niño and La Niña… …Well Just about Everything”. The Free Preview includes the Table of Contents; the Introduction; the beginning of Section 1, with the cartoon-like illustrations; the discussion About the Cover; and the Closing.
Please buy a copy. (Credit/Debit Card through PayPal. You do NOT need to open a PayPal account.) Simply scroll down to the “Don’t Have a PayPal Account” purchase option. It’s only US$8.00. Sales of my ebooks allow me to continue my research into human-induced and natural climate change and to continue to blog here at Climate Observations and at WattsUpWithThat?
Regards


Corrected typo: There [are] many other topics discussed in Who Turned on the Heat?
Thanks, Harold.
Bob, I appreciate your work here. I actually think I can understand the part about trade winds pushing water westward. Enjoy your comments at the usual places also
Bob, I have been noticing that the NOAA page forecasts have had a slight bias toward El Nino for several months now. Joe Bastardi on Dr Spencer’s blog noted that for the last 7 months, the weather model have forecast warm with the forecast getting colder when the actual day approaches. Have you noticed this bias?
John Owens
tomdesabla, thanks for letting me know that my blog posts are helping. NASA’s OceanMotion website has lots of additional information about wind-driven ocean currents:
http://www.oceanmotion.org/
Regards
Retired Engineer John: I agree. The IRI/CPC composite and the NCEP’s forecasts on pages 26 and 27 of the NOAA weekly ENSO update look a little unusual with the forecasts of positive NINO3.4 sea surface temperature anomalies.
Click to access enso_evolution-status-fcsts-web.pdf
This is the same explanation on RealClimate for how the ocean can both simultaneously heat and cool at the same time. They claim it is also the mechanism by which the deep ocean is heated: http://www.realclimate.org/index.php/archives/2013/09/what-ocean-heating-reveals-about-global-warming/
I’m curious what you might have to say about their hypothesis, given your knowledge of ENSO.
chuckarama: That blog post at RealClimate appeared when I was releasing my latest book. I always wanted to respond to it. Can your request wait a week for a full post?
Man has waited 300 millennia to discover the mysteries and secrets of the climate that surrounds him. I think we can give it another week or two.
This might be of interest to your response – just appeared in Nature today: http://www.nature.com/nclimate/journal/v3/n11/full/nclimate2039.html
“A study reveals that recent warming in the Indian Ocean and in the Pacific ‘warm pool’ has caused a cooling near the top of the tropical troposphere above, leading to less water vapour entering the stratosphere.”
…
“An increase in SST over the Indian Ocean and the far western Pacific enhances the deep convection and thus the latent heat release in the upper troposphere that increases the amplitude of the equatorial planetary waves. This leads to warming near 250 hPa, but cooling near 100 hPa, over the Indo-Pacific warm pool.”
Again, simultaneous warming and cooling due to ENSO, in the atmosphere this time,
chuckarama, thanks for the link.
Pingback: Learning about ENSO | CRIKEY !#&@ ...... IT'S THE WEATHER CYCLES
Pingback: The 1914/15 El Niño – Part 1 – The Initial Processes of the El Niño | Bob Tisdale – Climate Observations
Pingback: The 2014/15 El Niño – Part 1 – The Initial Processes of the El Niño | Bob Tisdale – Climate Observations
Pingback: The 2014/15 El Niño – Part 1 – The Initial Processes of the El Niño | Watts Up With That?
Pingback: The 2014/15 El Niño – Part 7 – May 2014 Update and What Should Happen Next | Bob Tisdale – Climate Observations
Pingback: The 2014/15 El Niño – Part 7 – May 2014 Update and What Should Happen Next | Watts Up With That?
Pingback: The 2014/15 El Niño – Part 8 – The Southern Oscillation Indices | Bob Tisdale – Climate Observations
Pingback: The 2014/15 El Niño – Part 8 – The Southern Oscillation Indices | Watts Up With That?
Pingback: The 2014/15 El Niño – Part 9 – Kevin Trenberth is Looking Forward to Another “Big Jump” | Bob Tisdale – Climate Observations
Pingback: The 2014/15 El Niño – Part 9 – Kevin Trenberth is Looking Forward to Another “Big Jump” | Watts Up With That?
Pingback: The 2014/15 El Niño – Part 10 – June 2014 Update – Still Waiting for the Feedbacks | Bob Tisdale – Climate Observations
Pingback: The 2014/15 El Niño – Part 10 – June 2014 Update – Still Waiting for the Feedbacks | Watts Up With That?
Pingback: The 2014/15 El Niño – Part 11 – Is the El Niño Dying? | Bob Tisdale – Climate Observations
Pingback: The 2014/15 El Niño – Part 11 – Is the El Niño Dying? | Watts Up With That?
Pingback: The 2014/15 El Niño – Part 12 – July 2014 Update – The Feedbacks Need to Kick in Soon | Bob Tisdale – Climate Observations
Pingback: The 2014/15 El Niño – Part 12 – July 2014 Update – The Feedbacks Need to Kick in Soon | Watts Up With That?
Pingback: The 2014/15 El Niño – Part 13 – More Mixed Signals | Bob Tisdale – Climate Observations
Pingback: The 2014/15 El Niño – Part 13 – More Mixed Signals | Watts Up With That?
Pingback: The 2014/15 El Niño – Part 14 – Warm Water Recirculated? | Bob Tisdale – Climate Observations
Pingback: The 2014/15 El Niño – Part 14 – Warm Water Recirculated? | Watts Up With That?
Pingback: The 2014/15 El Niño – Part 15 – August 2014 Update – An El Niño Mulligan? | Bob Tisdale – Climate Observations
Pingback: The 2014/15 El Niño – Part 15 – August 2014 Update – An El Niño Mulligan? | Watts Up With That?
Pingback: The 2014 15 El Niño – Part 15 – September 2014 Update – Still Seeing Mixed Signals | Bob Tisdale – Climate Observations
Pingback: The 2014 15 El Niño – Part 15 – September 2014 Update – Still Seeing Mixed Signals | Watts Up With That?
Pingback: The 2014/15 El Niño – Part 18 – October 2014 Update – One Last Chance? | Bob Tisdale – Climate Observations
Pingback: The 2014/15 El Niño – Part 18 – October 2014 Update – One Last Chance? | Watts Up With That?
Pingback: The 2014 15 El Niño – Part 19 – Is an El Niño Already Taking Place? | Bob Tisdale – Climate Observations
Pingback: The 2014/15 El Niño – Part 19 – Is an El Niño Already Taking Place? | Watts Up With That?
Pingback: The 2014/15 El Niño – November Update – The Little El Niño That Shoulda’-Woulda’-Coulda’ | Bob Tisdale – Climate Observations
Pingback: The 2014/15 El Niño – Part 20 – November Update – The Little El Niño That Shoulda’-Woulda’-Coulda’ | Watts Up With That?
Bob, Is this the right blog to contact you with comments not directly related to a specific topic on the site? Wanted to make some comments on WWB’s and a bit on other atmospheric waves like MRG etc? Or, is there a better way? Thanks.
You’ve come to the right place, Weather Dave. If you want to comment on a more recent thread, that’s okay too.
good morning Bob from Down Under. I first want to express my appreciation for the incredible work you do; as a yacht forecaster your presentations are most useful. My interest is more operational forecasting; during ‘cruising season’ in the SW Pacific we run Gulf Harbour Radio and forecast weather for most of the Island Groups from French Polynesia to the east coast of Oz. This last season we had roughly 500 yachts tune in and register on our blog. Well there are a couple of things I’d like to touch base with you on.
1. Over the years I’ve seen the number of ENSO definitions look like a bowl of spagetti and not the ensemble type. What ever happened to the simple and original data of sea surface temps (SST) off the coast of Equador, Peru and Columbia and the state of the Anchovy fishery? I’ll reflect my age by sticking with the original definition. BoM of course sticks with 3.4 and SOI and I see the value of the data but none of it has proved to have the skill scores necessary for forecasting.
2. WWB. I think this is mis-understood by many. The majority of the surface winds in the southern tropics are easterly quadrant. This changes in three general ways. The most dependable cause of westerlies north of OZ is of course the yearly monsoon. As you are aware the big Highs in Asia ridge southward bringing winds across the equator, turning left to become westerlies. This is about the time of the year for this to occur and of course along with it is the nearly dependable Monsoon trough. The next cause is the MJO. I’m surprised I don’t see this on the blogs. This cycle is extremely important for my forecasting and the pulse does bring westerlies. Nothing new here; all operational forecasters play very close attention to it; picked up by ASCAT satellite for the wind and IR loops. The last cause is cross equatorial wind. These occur often in conjunction with the MJO or the SPCZ. They are usually not very strong. Now along these lines is a puzzle maybe you can answer. Why does NOAA insist on using 850 winds for trade anomolies? This is amazing to me. The flow at 850 is above the friction zone and often has no relation to surface winds. At times it flows opposite to surface winds and points in between.
Anyway back to the monsoon winds and mjo, these are so regular during any given year that when they occur its a ho hum for me but the blogs go crazy as if this it! The start of something BIG! There is a disconnect with folks who look at this data everyday and those that just read someones announcement in a blog. And finally its the travelling Anticyclones that really affect the trades who in turn are created ultimately by the jet with its twists and turns. These Highs eventually get absorbed into the semi-permanent High off S. America and the cycles continue.
3, The ‘Cause’ of ENSO. I like your attitude about this; no one really knows but very few pick up other rather regular atmospheric cycles that could help the understanding. Examples are the MRG or mixed Rossby-gravity wave, the Kelvin atmospheric wave, and the ER1 wave. All of these affect the trades but I never see anyone addressing them. BoM forecasts them and while the impact is probably small they’re possibly cumulative and may very well influence ENSO.
Probably enough from me. I’m the sort that does not like anomolies and charts thereof. I like real data, real wind speed, real wind direction. I like to confirm this with satellite data, yacht reports, fisherman reports ( Very useful for sea temps are my Albacore boats I communicate with; they live and die with the thermocline and fish from roughly 4S to 20S. They are the source of a wealth of information regarding sea temps). I just don’t see how anyone can truly visualize let alone understand what is happening without the actual data.
Thanks for the time and look forward to your comments.
Hi WeatherDave. Thanks for commenting.
I have to assume that different agencies around the globe define ENSO events based on the indices that have historically worked for them…for some with their regional forecasts and for others with the impacts of ENSO globally as they relate to global warming. It will be interesting to watch to see how and if the definitions shift now that it appears we’re in a new (old) regime where ENSO events evolve differently than they had in recent decades. The ENSO models were prepared during one regime and now we’re likely in another. The ENSO modelers have to be pulling their hair out.
Imagine working for a bureaucracy the size of NOAA, with all of its departments and politics. Somewhere along the line, they standardized on a subset of a reanalysis (the winds at 850mb) that appeared to work for them for their definitions of westerly wind bursts as they relate to ENSO forecasts. Now it would probably take months of meetings with numerous committees for them to change it. Then again, many of us are looking for historical “data” as well, for example west of where the TAO project buoys reside so we have to rely on the longer-term reanalyses.
The MJO: a couple of the weather blogs had mentioned the MJO last boreal spring and summer…back when everyone was waiting for the next westerly wind burst to help the initial Kelvin wave. But the predictions people were making never came to pass. I had actually started an intro post on the MJO but didn’t get a chance (or have the need) to finish it and post it.
Cheers.
Pingback: March 2015 ENSO Update – Will the 2014/15 El Niño Become the 2014/15/16 El Niño? | Watts Up With That?
Pingback: May 2015 ENSO Update – Australia’s BOM and the JMA Declare an El Niño and With Them Comes the Typical Nonsense from an Expert Source | Watts Up With That?
Pingback: June 2015 ENSO Update – Tropical Pacific Approaching the Threshold of a Strong El Niño | Watts Up With That?
Pingback: Quicky Early July 2015 ENSO Update: NINO3 (not NINO3.4) Sea Surface Temperature Anomalies Reached 2.0 Deg C Last Week | Watts Up With That?
Pingback: Quicky Early July 2015 ENSO Update: NINO3 (not NINO3.4) Sea Surface Temperature Anomalies Reached 2.0 Deg C Last Week | I World New
Pingback: July 2015 ENSO Update – Tropical Pacific at the Threshold of a Strong El Niño | Watts Up With That?
Pingback: Quicky Early August 2015 ENSO Update: NINO3.4 Sea Surface Temperature Anomalies Still Just Above the Threshold of a Strong El Niño | Watts Up With That?
Pingback: August 2015 ENSO Update – Another Westerly Wind Burst in Late July Should Help El Niño Evolve | Watts Up With That?
Pingback: Axel Timmermann and Kevin Trenberth Highlight the Importance of Natural Variability in Global Warming… | Bob Tisdale – Climate Observations
Pingback: September 2015 ENSO Update – Sea Surface Temperatures Continue to Rise in the Central Equatorial Pacific | Watts Up With That?
Pingback: October 2015 ENSO Update – Comparisons with the Other Satellite-Era Multiyear El Niño | Watts Up With That?
Pingback: December 2015 ENSO Update – Shouldn’t Be Long Now Until the El Niño Starts to Decay | Watts Up With That?
Pingback: January 2016 ENSO Update – It Appears the El Niño Has Peaked | Watts Up With That?
Pingback: March 2016 ENSO Update – We’ll Have to Keep an Eye on the Pocket of Warm Water South of the Equator | Watts Up With That?
Pingback: April 2016 ENSO Update – La Niña Alerts Issued for Later This Year and NINO1+2 SSTa Are Near Zero Deg C | Watts Up With That?
Pingback: May 2016 ENSO Update – The 2015/16 El Niño Has Reached Its End | Watts Up With That?