
MONTHLY SEA SURFACE TEMPERATURE ANOMALY MAP
The following is a Global map of Reynolds OI.v2 Sea Surface Temperature (SST) anomalies for October 2015. It was downloaded from the KNMI Climate Explorer. The contour range was set to -2.5 to +2.5 deg C and the anomalies are referenced to the WMO-preferred period of 1981-2010.

October 2015 Sea Surface Temperature (SST) Anomalies Map
(Global SST Anomaly = +0.438 deg C)
MONTHLY GLOBAL OVERVIEW
Global Sea Surface Temperature anomalies warmed very little, an increase of about +0.009 deg C, from September to October. Surface temperature anomalies rose in the Southern Hemisphere, but showed little change in the Northern Hemisphere. Last month, the only basins with sizable increases were the North Atlantic and Indian Oceans, but they were countered by decreases in other basins. As the El Niño continues to develop, we should expect increases around the globe. The monthly Global Sea Surface Temperature anomalies are presently at +0.438 deg C, referenced to the WMO-preferred base years of 1981 to 2010.

(1)Global Sea Surface Temperature Anomalies
Monthly Change = +0.009 deg C
THE EQUATORIAL PACIFIC
The monthly NINO3.4 Sea Surface Temperature anomalies for October 2015 are well above the +1.5 deg C threshold of a strong El Niño and continuing to rise. They are presently at +2.47 deg C, another noticeable increase since the prior month…having increased about +0.21 deg C since September.

(2) NINO3.4 Sea Surface Temperature Anomalies
(5S-5N, 170W-120W)
Monthly Change = +0.206 deg C
####################################
The sea surface temperature anomalies for the NINO3.4 region in the east-central equatorial Pacific (5S-5N, 170E-120E) are a commonly used index for the strength, frequency and duration of El Niño and La Nina events. We keep an eye on the sea surface temperatures there because El Niño and La Niña events are the primary cause of the yearly variations in global sea surface temperatures AND they are the primary cause of the long-term warming of global sea surface temperatures over the past 30 years. See the discussion of the East Pacific versus the Rest-of-the-World that follows. We present NINO3.4 sea surface temperature anomalies in monthly and weekly formats in these updates.
Also see the weekly values toward the end of the post.
INITIAL NOTES
Note 1: Because the NOMADS servers are off line, I’ve downloaded the Reynolds OI.v2 values from the KNMI Climate Explorer, using the base years of 1981-2010. The updated base years help to reduce the seasonal components in the ocean-basin subsets—they don’t eliminate those seasonal components, but they reduce them.
Note 2: We discussed the reasons for the elevated sea surface temperatures in the post On The Recent Record-High Global Sea Surface Temperatures – The Wheres and Whys.
Note 3: I’ve moved the model-data comparison to the end of the post.
Note 4: I recently added a graph of the sea surface temperature anomalies for The Blob in the eastern extratropical North Pacific. It also is toward the end of the post.
THE EAST PACIFIC VERSUS THE REST OF THE WORLD
NOTE: This section of the updates has been revised. We discussed the reasons for the changes in the post Changes to the Monthly Sea Surface Temperature Anomaly Updates.
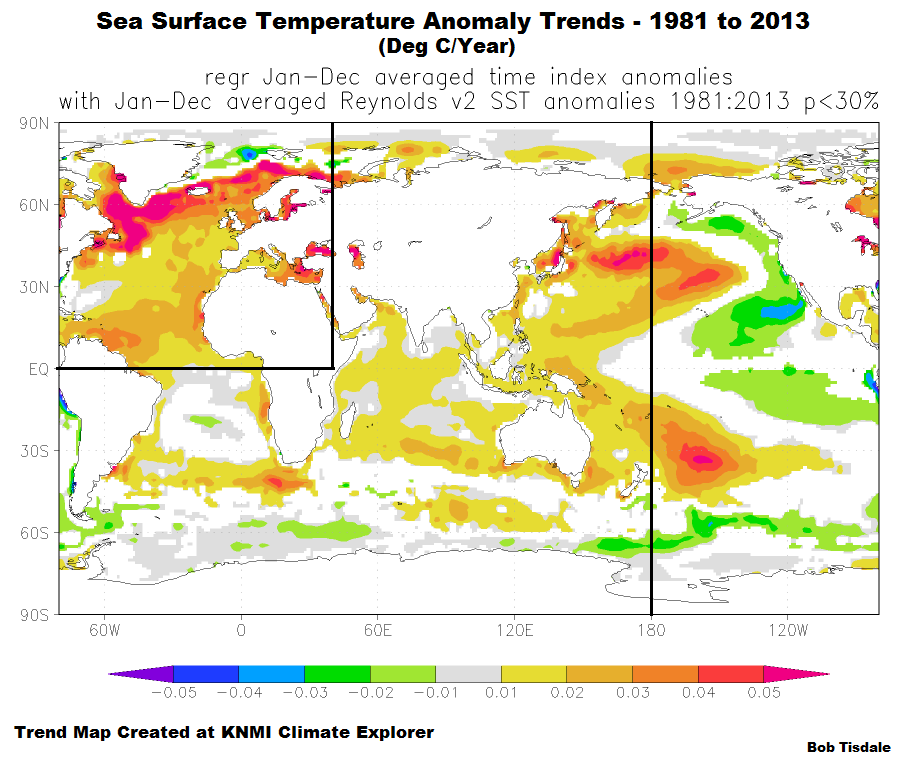
For years, we have shown and discussed that the surfaces of the global oceans have not warmed uniformly during the satellite era of sea surface temperature composite. In fact, some portions of the global oceans have cooled during that 3+ decade period. One simply has to look at a trend map for the period of 1982 to 2013 to see where the ocean surfaces had warmed and where they had not. Yet the climate science community has not addressed this. See the post Maybe the IPCC’s Modelers Should Try to Simulate Earth’s Oceans.
The North Atlantic (anomalies illustrated later in the post) has had the greatest warming over the past 3+ decades, but the reason for this is widely known. The North Atlantic has an additional mode of natural variability called the Atlantic Multidecadal Oscillation. If you’re not familiar with the Atlantic Multidecadal Oscillation see the NOAA Frequently Asked Questions About the Atlantic Multidecadal Oscillation (AMO) webpage and the posts An Introduction To ENSO, AMO, and PDO — Part 2 and Multidecadal Variations and Sea Surface Temperature Reconstructions. As a result of the Atlantic Multidecadal Oscillation, the surface of the North Atlantic warmed at a rate that was more than twice the rate of the surface of the rest of the global oceans. See the trend comparison graph here.
The East Pacific Ocean also stands out in the trend map linked above. Some portions of its surfaces warmed and others cooled. It comes as no surprise then that the linear trend of the East Pacific (90S-90N, 180-80W) Sea Surface Temperature anomalies since the start of the Reynolds OI.v2 composite is so low. With the strong El Nino conditions in the eastern tropical Pacific and The Blob, it has acquired a slight positive trend, but it’s still far below the approximate +0.15 deg C/decade warming rate predicted by the CMIP5 climate models. Please see Figure 19 in the post Maybe the IPCC’s Modelers Should Try to Simulate Earth’s Oceans. (Note that the region also includes portions of the Arctic and Southern Oceans.) That is, there has been little warming of the sea surfaces of the East Pacific (from pole to pole) in 32 years. The East Pacific is not a small region. It represents about 33% of the surface area of the global oceans.
Notice how there appears to have been a strong El Niño event in 2014 in the East Pacific values, while there had only been a small off season event that year, and how the strong El Niño in 2015 is causing a further rise. Note also how there appears to have been a shift in 2013. Refer again to the post On The Recent Record-High Global Sea Surface Temperatures – The Wheres and Whys. (With the exception of the Indian Ocean, the other ocean basins, thankfully, have not yet responded with a sharp rise…yet.)

(3) East Pacific Sea Surface Temperature (SST) Anomalies
(90S-90N, 180-80W)
####################################
That leaves the largest region of the trend map, which includes the South Atlantic, the Indian and West Pacific Oceans, with the corresponding portions of the Arctic and Southern Oceans. Sea surface temperatures there warmed in very clear steps, in response to the significant 1986/87/88 and 1997/98 El Niño/La Niña events. It also appears as though the sea surface temperature anomalies of this subset have made another upward shift in response to the 2009/10 El Niño and 2010/11 La Niña events. I further described the ENSO-related processes that cause these upward steps in the recent post Answer to the Question Posed at Climate Etc.: By What Mechanism Does an El Niño Contribute to Global Warming?
Again, as you’ll note, the values for the South Atlantic, Indian and West Pacific Oceans do not show anything unusual this year. (And as you’ll see later, the North Atlantic is presently showing the “normal” range of seasonal variations, but the Indian Ocean has shown a large upswing recently.)

(4) Sea Surface Temperature Anomalies For The South Atlantic-Indian-West Pacific Oceans
(Weighted Average of 0-90N, 40E-180 @ 27.9% And 90S-0, 80W-180 @72.1%)
####################################
The periods used for the average temperature anomalies for the South Atlantic-Indian-West Pacific subset between the significant El Niño events of 1982/83, 1986/87/88, 1997/98, and 2009/10 are determined as follows. Using the original NOAA Oceanic Nino Index (ONI) for the official months of those El Niño events, I shifted (lagged) those El Niño periods by six months to accommodate the lag between NINO3.4 SST anomalies and the response of the South Atlantic-Indian-West Pacific Oceans, then deleted the South Atlantic-Indian-West Pacific values that corresponds to those significant El Niño events. I then averaged the South Atlantic-Indian-West Pacific Oceans sea surface temperature anomalies between those El Niño-related gaps.
You’ll note I’ve ended the updates for the period after the 2009-10 El Niño. That was done to accommodate the expected response to the 2015/16 El Niño.
The Sea Surface Temperature anomalies of the East Pacific Ocean, or approximately 33% of the surface area of the global oceans, have shown comparatively little long-term warming since 1982 based on the linear trend. And between upward shifts, the Sea Surface Temperature anomalies for the South Atlantic-Indian-West Pacific subset (about 52.5% of the global ocean surface area) remain relatively flat, though they actually cool slightly. Anthropogenic forcings are said to be responsible for most of the rise in global surface temperatures over this period, but the Sea Surface Temperature anomaly graphs of those regions discussed above prompt a two-part question: Since 1982, what anthropogenic global warming processes would overlook the sea surface temperatures of 33% of the global oceans and have an impact on the other 52% but only during the months of the significant El Niño events of 1986/87/88, 1997/98 and 2009/10?
They were also discussed in great detail in my ebook Who Turned on the Heat? The Unsuspected Global Warming Culprit, El Niño-Southern Oscillation. The Free Preview includes the Table of Contents; the Introduction; the beginning of Section 1, with the cartoon-like illustrations; the discussion About the Cover; and the Closing. Also see the blog post Everything You Every Wanted to Know about El Niño and La Niña… for an overview. It’s now sale priced at US$5.00. Please click here to buy a copy. (Paypal or Credit/Debit Card. You do not need to open a PayPal account.)
STANDARD NOTE ABOUT THE REYNOLDS OI.V2 COMPOSITE
The MONTHLY graphs illustrate raw monthly OI.v2 sea surface temperature anomalies from November 1981 to October 2015, as it is presented by the KNMI Climate Explorer linked at the end of the post. While NOAA uses the base years of 1971-2000 for this product, those base years cannot be used at the KNMI Climate Explorer because they extend before the start year of the product. (NOAA had created a special climatology for the Reynolds OI.v2 product.) I’ve referenced the anomalies to the period of 1981 to 2010, which is actually 1982 to 2010 for most months. And I’ve added a 13-month running-average filter to smooth out the seasonal variations.
MONTHLY INDIVIDUAL OCEAN AND HEMISPHERIC SEA SURFACE TEMPERATURE UPDATES

(5) Northern Hemisphere Sea Surface Temperature (SST) Anomalies
Monthly Change = +0.001 deg C
####################################

(6) Southern Hemisphere Sea Surface Temperature (SST) Anomalies
Monthly Change = +0.016 deg C
####################################

(7) North Atlantic Sea Surface Temperature (SST) Anomalies
(0 to 70N, 80W to 0)
Monthly Change = +0.054 deg C
####################################

(8) South Atlantic Sea Surface Temperature (SST) Anomalies
(0 to 60S, 70W to 20E)
Monthly Change = -0.013 deg C
####################################

(9) Pacific Sea Surface Temperature (SST) Anomalies
(60S to 65N, 120E to 80W)
Monthly Change = -0.018 Deg C
####################################

(10) North Pacific Sea Surface Temperature (SST) Anomalies
(0 to 65N, 100E to 90W)
Monthly Change = -0.011 Deg C
####################################

(11) South Pacific Sea Surface Temperature (SST) Anomalies
(0 to 60S, 120E to 70W)
Monthly Change = -0.022 deg C
####################################

(12) Indian Ocean Sea Surface Temperature (SST) Anomalies
(60S to 30N, 20E to 120E)
Monthly Change = +0.120 deg C
####################################

(13) Arctic Ocean Sea Surface Temperature (SST) Anomalies
(65N to 90N)
Monthly Change = -0.114 deg C
####################################

(14) Southern Ocean Sea Surface Temperature (SST) Anomalies
(90S-60S)
Monthly Change = -0.030 deg C
####################################
WEEKLY SEA SURFACE TEMPERATURE ANOMALIES
Weekly NINO3.4 sea surface temperature anomalies are at +2.8 deg C. They are comparable to the peak anomalies reached during the 1997/98 El Niño. But as discussed in the most recent ENSO update, the 1997/98 El Niño was a stronger East Pacific El Niño than the one taking place now.

(15) Weekly NINO3.4 Sea Surface Temperature (SST) Anomalies
Note: With the NOMADS servers off line, I’ve used the weekly NINO3.4 values available from the NOAA/CPC Monthly Atmospheric & SST Indices webpage, specifically the listing here. They do not provide the global values on a weekly basis, so I can’t present it. Sorry.
####################################
MODEL-DATA COMPARISON: To counter the nonsensical “Just what AGW predicts” rantings of alarmists about the “record-high” global sea surface temperatures in 2014 (and in 2015), I’ve added a model-data comparison of satellite-era global sea surface temperatures to these monthly updates. See the example below. The models are represented the multi-model ensemble-member mean of the climate models stored in the CMIP5 archive, which was used by the IPCC for their 5th Assessment Report. For further information on the use of the model mean, see the post here. For most models, historic forcings run through 2005 (2012 for others) and the middle-of-the-road RCP6.0 forcings are used after in this comparison. The data are represented by NOAA’s Optimum Interpolation Sea Surface Temperature data, version 2—a.k.a. Reynolds OI.v2—which is NOAA’s best. The model outputs and data have been shifted so that their trend lines begin at “zero” anomaly for the (November, 1981) start month of this composite. That “zeroing” helps to highlight how poorly the models simulate the warming of the ocean surfaces…almost doubling the observed warming rate. Both the Reynolds OI.v2 values and the model outputs of their simulations of sea surface temperature (TOS) are available to the public at the KNMI Climate Explorer.

000 – Model-Data Comparison
Linked here is an illustration that compares maps of the simulated and observed warming rates of the global oceans from 1982 to 2014. It is from the post Alarmists Bizarrely Claim “Just what AGW predicts” about the Record High Global Sea Surface Temperatures in 2014.
This addition to the monthly update was further discussed in the post The Nonsensical “Just What AGW predicts” and Other Claims By Alarmists about “Record-High” Global Sea Surface Temperatures in 2014.
####################################
THE BLOB
After decades of no surface warming in the North Pacific as a whole, a prolonged weather event in the eastern extratropical North Pacific caused an unusual and unexpected warming there, raising sea surface temperatures in the North Pacific to new levels. That region of unusually warm sea surfaces in the eastern extratropical North Pacific has become known as The Blob. We’ve discussed The Blob in detail in the recent post North Pacific Update: The Blob’s Strengthening Suggests It’s Not Ready to Depart. There are links to numerous earlier discussions of the North Pacific in that post, some reaching back as far as the boreal summer of 2013.
I’ve added a graph of the sea surface temperature anomalies for The Blob region so that we can keep track of how it responds to the developing El Niño. Keep in mind, the The Blob covers a relatively small part of the North Pacific, so the anomalies will be volatile.

(16) The Blob
(35N-55N, 150W-125W)
Monthly Change = +0.122 deg C
INTERESTED IN LEARNING MORE ABOUT HOW AND WHY THE GLOBAL OCEANS INDICATE THEY’VE WARMED NATURALLY?
Why should you be interested? The hypothesis of manmade global warming depends on manmade greenhouse gases being the cause of the recent warming. But the sea surface temperature record indicates El Niño and La Niña events are responsible for the warming of global sea surface temperature anomalies over the past 32 years, not manmade greenhouse gases. Scroll back up to the discussion of the East Pacific versus the Rest of the World. I’ve searched sea surface temperature records for more than 4 years, and I can find no evidence of an anthropogenic greenhouse gas signal. That is, the warming of the global oceans has been caused by Mother Nature, not anthropogenic greenhouse gases.
I’ve recently published my e-book (pdf) about the phenomena called El Niño and La Niña. It’s titled Who Turned on the Heat? with the subtitle The Unsuspected Global Warming Culprit, El Niño Southern Oscillation. It is intended for persons (with or without technical backgrounds) interested in learning about El Niño and La Niña events and in understanding the natural causes of the warming of our global oceans for the past 30 years. Because land surface air temperatures simply exaggerate the natural warming of the global oceans over annual and multidecadal time periods, the vast majority of the warming taking place on land is natural as well. The book is the product of years of research of the satellite-era sea surface temperature data that’s available to the public via the internet. It presents how the data accounts for its warming—and there are no indications the warming was caused by manmade greenhouse gases. None at all.
Who Turned on the Heat? was introduced in the blog post Everything You Ever Wanted to Know about El Niño and La Niña… …Well Just about Everything. The Free Preview includes the Table of Contents; the Introduction; the beginning of Section 1, with the cartoon-like illustrations; the discussion About the Cover; and the Closing.
Please buy a copy. (Paypal or Credit/Debit Card). You do not need to have a PayPal account. Simply scroll down to the “Don’t Have a PayPal Account” purchase option. It’s now sale priced at US$5.00.
SOURCES
The monthly Sea Surface Temperature (SST) anomalies and model outputs used in this post are available from the KNMI Climate Explorer.


Thanks, Bob. This El Niño looks like it still has something more to say.
Naturally warming from sunlight is good!
Everybody should be happier, even the alarmists, not having to explain away a continuing “hiatus”, or even worse, a bout of global cooling! 😉
Pingback: ENSO Update: SOI-Tageswert erstmals seit zwei Monaten positiv – El Niño beginnt zu schwächeln… | wobleibtdieglobaleerwaermung
Pingback: Wie “warm” wird der November 2015 global? Satelliten zeigen Abkühlung gegenüber Oktober! | wobleibtdieglobaleerwaermung
I am still wondering about the lack of elevated temps in the warm pool. If the winds are not blowing the warmed surface water to the warm pool, recharging it, wouldn’t this indicate that the so called El Nino is at least partially just the lack of cooling from the winds??
Without the warm pool being recharged there will be little knock on effect and little heat being distributed to the other oceans by currents.
Or am I misconscrewing what I have read previously??
kuhnkat, first, by “warm pool”, I’m assuming you’re talking about the West Pacific Warm Pool.
Second, the recharge takes place during the La Nina phase, not the El Nino.
Third, during an El Nino, warm water from the West Pacific Warm Pool migrates east, so the sea surface temperatures in the should not be elevated now in the West Pacific Warm Pool.
Thank you Bob. I misremembered just about everything it appears.
Bob- I have noticed on the Queensland “Long Paddock” page, the SOI Value appears to be
dropping rapidly – Link : https://www.longpaddock.qld.gov.au/
Thanks..
tgmccoy, thanks for the heads-up. The SOI has been bouncing into positive values for almost a week.
https://www.longpaddock.qld.gov.au/seasonalclimateoutlook/southernoscillationindex/30daysoivalues/
Cheers.
A little o/t, anyway… I come back to the “pause buster” new SST record ERSSTv4. I compared the global trends via climate explorer with HadIsst1 and found a IMO remarkable result.

The HadIsst1 trends from 1950-2014: http://climexp.knmi.nl/data/g20151120_1729_26483_1.png
The ERSSTv4 trends in the same time:
(links will be broken in a few days)
The “reason” for making a new record was: There are some inconsistencies with buyos and ship-measurements. How can it be that the trends near the antarctic ( southward 30S) are so different, in many regions they shiftet from negative to positive? We know that the seaice there increased in the last few years, this would be a hint for negative SST-trends not for positive ones. When you subtract the HasIsst1 from the ERSSTv4 for 30…70S you’ll see a “cooling” in ERSSTv4 from 1950-1975 and a heating after 2008 of about 0.15K. The comparison of SST southward 50S with the seaice there shows the problems of ERSSTv4 very clear. It’s boiled!
Frank, to determine trends at the KNMI Climate Explorer, use “regression” with time, not “correlation”. Same webpage, different menu choice.
I made the same mistake in a post once.
Cheers.
Yes, you are right, anyway: The result is similar. The correlation between ERSSTv4 and HadIsst1:
http://climexp.knmi.nl/data/g20151121_0810_31088_1.png . The big differences are located southward 40 S . When you compare it with the seaice area ( I selected january at NSIDC)
http://www.bilder-upload.eu/show.php?file=5ac461-1448096352.gif ( [IMG]http://www.bilder-upload.eu/thumb/5ac461-1448096352.gif[/IMG][/URL] ) you can see the uplift of ERSSTv4 after 2008 which is not plausible.
Pingback: “Global Warming” Reality Check Oktober 2015 – Die globale Abkühlung seit 1998 dauert an: RSS 0,44 | wobleibtdieglobaleerwaermung