
*Or Maybe the GISS Land-Ocean Temperature Index is Redundant.
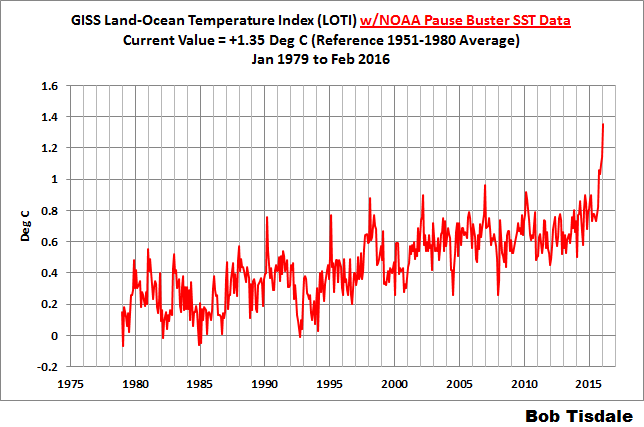
In the post Alarmism Cranked Up to Absurd Level, we discussed the misleading media reports about the temporary February 2016 El Niño-related uptick in monthly global surface temperature data from the Goddard Institute of Space Studies. There have been numerous new same-topic news articles since NOAA released its February 2016 global temperature data a few days ago. The NOAA/NCEI data show an uptick similar to the one we recently saw with the GISS data. See Figure 1. (A similar graph of the GISS data is here.)

Figure 1
(Data can be found here.)
Let’s focus on the AP story Beyond record hot, February was ‘astronomical’ and ‘strange’ by Seth Borenstein. It begins:
WASHINGTON (AP) — Earth got so hot last month that federal scientists struggled to find words, describing temperatures as “astronomical,” ”staggering” and “strange.” They warned that the climate may have moved into a new and hotter neighborhood.
Let’s see to whom Seth Borenstein attributes the “astronomical,” ”staggering” and “strange.”
“Astronomical” comes from NOAA’s Jessica Blundel. The AP article reads:
“The departures are what we would consider astronomical,” Blunden said. “It’s on land. It’s in the oceans. It’s in the upper atmosphere. It’s in the lower atmosphere. The Arctic had record low sea ice.”
The “staggering” comes from NOAA’s Deke Arndt, Chief of the Climate Monitoring Branch, at their National Center for Environmental Information (NCEI):
Scientists at NOAA’s National Centers for Environmental Information in Asheville, North Carolina, were astonished by the “staggering” numbers, said Deke Arndt, the centers’ global monitoring chief.
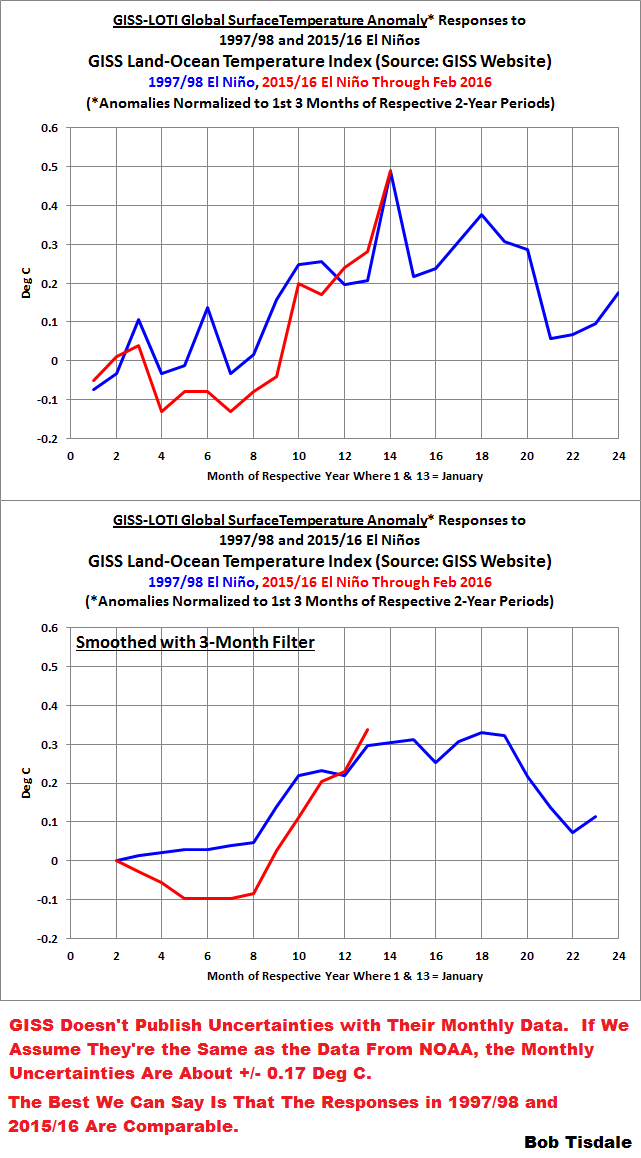
One wonders why NOAA’s scientists were “astonished” or consider the uptick “staggering” and “astronomical” when the 2015/16 El Niño has been compared in strength to the 1997/98 El Niño for many months. See NOAA’s Oceanic Nino Index, which is their “official” metric for monitoring the strengths, timings and durations of El Niño and La Niña events. It only takes a quick comparison graph, Figure 2, to show that there were comparable responses in global surface temperatures to both strong El Niños.

Figure 2
What many readers of that article are likely finding “astonishing” and “staggering” is that NOAA’s scientists weren’t aware that global surface temperatures were going to respond as they have, given that there was a similar uptick in global surface temperatures in response to the similarly sized 1997/98 El Niño. If the scientists had been aware, they wouldn’t have been astronomically astonished.
Notes about Figure 2: It compares the responses of global surface temperatures to the 1997/98 and 2015 El Niño events. The data have been normalized to the first 3 months of their respective first years. The normalization was done so that we can easily compare, visually, the responses of global surface temperatures to the two comparably sized strong El Niño events. This is not an attempt to hide the fact that global surfaces have warmed between the two events, according to the NOAA land+ocean data. In Figure 2, we’re simply providing a side-by-side comparison.
The recent monthly uncertainties in the NOAA data are about +/- 0.17 Deg C. (See the NOAA webpage here.) The best we can say is that the global temperature responses to both El Niño events were comparable, given the uncertainties of the data.
That land+ocean dataset from NOAA includes their new ERSST.v4 “pause buster” sea surface temperature data. It has many curiosities over the term of the data, as discussed and illustrated in the posts here and here.
[End notes]
And the “strange” reportedly comes from Gavin Schmidt, Director of the Goddard Institute of Space Studies:
NASA’s chief climate scientist Gavin Schmidt usually discounts the importance of individual record hot months, but said this month was different, calling it “obviously strange.”
Looking again at Figure 2, or the comparable graph using the GISS Land-Ocean Temperature Index data here from the post Alarmism Cranked Up to Absurd Level, there was nothing “obviously strange” about the response of global surface temperatures to this El Niño. It’s precisely what we would expect. If global surfaces had not warmed in response to the 2015/16 El Niño similarly to how they responded to the one in 1997/98, that would have been “obviously strange”.
Another quote from NOAA’s Deke Arndt:
“Usually these are monthly reminders that things are changing,” Arndt said. “The last six months have been more than a reminder, it’s been like a punch in the nose.”
Figure 3 illustrates the 6-month changes in global surface temperature anomalies over the term of the NOAA land+ocean surface temperature data. The recent 6-month change (February 2016 minus September 2015) in surface temperature anomalies (+0.29 deg C) has been exceeded many times in the past.

Figure 3
When you read quotes like the one from NOAA’s Chief of the Climate Monitoring Branch at their National Center for Environmental Information, you might begin to wonder whether NOAA scientists bother to examine their own data.
CLOSING
As expected, the comical alarmism about the recent uptick in global surface temperature anomalies continued with the release of the NOAA data for February. Toward the end of this month, we should expect see it again when the UKMO releases their monthly update.
With the global warming misinformation and misleading alarmism coming from NOAA scientists, one might conclude they’ve lost their objectivity. Thus, many readers might agree with Congressman Lamar Smith who was recently reported to have said in the ChristianScienceMonitor article NOAA should focus on weather, not climate change, says Rep. Lamar Smith:
“Instead of hyping a climate change agenda, NOAA should focus its efforts on producing sound science and improving methods of data collection,” said Smith. “NOAA should prioritize areas of research that significantly impact Americans today, such as ways to improve weather forecasting. Unfortunately,climate alarmism often takes priority at NOAA.”
FOR THOSE NEW TO DISCUSSIONS OF EL NIÑO EVENTS AND THE REASONS FOR THE RECENT REPORTS OF RECORD HIGH SURFACE TEMPERATURES
I discussed in detail the naturally occurring and naturally fueled processes that cause El Niño events (and their long-term aftereffects) in Chapter 3.7 of my recently published free ebook On Global Warming and the Illusion of Control (25 MB). For those wanting even more detail, see my earlier ebook Who Turned on the Heat? – The Unsuspected Global Warming Culprit: El Niño-Southern Oscillation. Who Turned on the Heat? only costs $5.00 (US).
And we discussed and illustrated the natural causes of the 2014 “record high” surface temperatures in General Discussion 2 of my free ebook On Global Warming and the Illusion of Control (25 MB). And we discussed the naturally caused reasons for the record highs in 2015 in General Discussion 3.


it does not really matter what the temperature is if it cannot be shown that it has something to do with fossil fuel emissions
http://papers.ssrn.com/sol3/papers.cfm?abstract_id=2725743
Bob,
Good points. However, are the starting conditions the same for 97-98 vs 2015-2016? Wasn’t there la nina conditions during end of 96? Whereas conditions were neutral/weak el nino at end of 14. So 2015 is starting from a higher position relative to underlying trend..
Using UAH V6 Ken Stewart has shown a pause over the majority of the planet and 6 areas now exceed 20 years. Many of those areas must have had no statistically significant warming for over 25 years.
Even the N extra tropics must have had no SS warming for a long time. Of course the south polar zone has had no warming since DEC 1978. This is worth a read and thanks again Bob. BTW any comments about Ken’s post Bob.
Nate, I’ve previously mentioned that 2015 started near weak El Nino conditions while the 1997 began near weak La Nina conditions.
ngard2016, it appears that Ken Stewart has filtered the data without specifying what he’s done. The filtering can skew the results.
Nice Hokey Schtick in Fig.1, Bob.
Looks like NOAA/NCEI have been taking lessons on data Mannipulation from the Master Mannipulator himself.
Reblogged this on ClimateTheTruth.com.
Pingback: More Alarmist Nonsense By NOAA | The Global Warming Policy Forum (GWPF)
Catweasel-
It’s not manipulated. Upper ocean ohc 0-100M is way above 1998, 2005, 2010 levels.
Which is a precursor to surface temps.
El Nino events might redistribute heat into the lower troposphere and adjacent ocean basins.
However LA Nina events have no lasting cooling effect in spite of temporary lowering water vapor just as much as el nino causes it to rise.
This ninos impact on the upper ocean heat ledger is huge because the enso 4 region and around that region including parts of the SPAC and Indian ocean have seen record warm ssts.
These regions happen to also be the warmest regions on Earth ocean surface wise.
So a 1.5C anomaly there is much more impactful total heat wise than a 4.0C anomaly over enso 1/2.
Also RSS and UAH 5.6 and 6.5 look like hockey sticks as well
Pingback: The Battle For Free Speech In Science Has Begun | Atlas Monitor
Pingback: Weekly Climate and Energy News Roundup #220 | Watts Up With That?
Pingback: Weekly Climate and Energy News Roundup #220 | Watts Up With That?
Pingback: February 2016 Global Surface Temperature Anomalies May or May Not Have Been Highest on Record, According to the UKMO | Bob Tisdale – Climate Observations
Pingback: February 2016 Global Surface Temperature Anomalies May or May Not Have Been Highest on Record, According to the UKMO | Watts Up With That?