
UPDATE: Corrected a couple of typos. Strike-throughs are followed by corrections. Thanks to Steve C for finding them on the cross post at WattsUpWithThat.
HHHHHHHHHHHHHH
This post presents reference graphs and a discussion of the effects of the Atlantic Multidecadal Oscillation on Arctic sea ice loss.
I was asked to show if and how well the Atlantic Multidecadal Oscillation (AMO) Index data correlates with the NSIDC Northern Hemisphere Sea Ice Extent data. I decided to carry the comparisons farther by also including high-latitude Northern Hemisphere temperature variables: land surface temperature anomalies, lower troposphere temperature anomalies, and a couple of sea surface temperature anomaly subsets. It should really come as no surprise that the high-latitude sea surface temperature anomalies in the Northern Hemisphere correlate best with Arctic sea ice extent anomalies. When the ice melts, it exposes the ocean surface. The surface temperature of the Arctic Ocean is warmer than ice so it will present a positive anomaly in areas where the sea ice hasn’t melted in the past. That is, where the freezing point of sea water serves as the base-period temperatures for anomalies, the surface temperature anomaly of any newly exposed water will be positive.
And I elected also to discuss the Atlantic Multidecadal Oscillation, its impacts, how it’s influenced by major El Niño events and how it’s misrepresented.
WHAT’S ALL THE HUBUB, BUB?
In a warming world, there are many expected responses. Among them, sea level will rise, glaciers will melt, and seasonal Arctic sea ice extent, area and mass will dwindle. Regardless of the source of the warming, those things will happen as global temperatures rise. I’m always amazed with the frenzy that accompanies a “new record” level in some variable, like the recent happenings with Arctic sea ice. While there is no proof mankind is responsible for the warming Arctic temperatures and loss of sea ice, there are, nonetheless, the typical baseless claims that we have caused it and we have to do to something about it.
The only place anthropogenic global warming definitely exists is in climate models. They must be FORCED by greenhouse gases in order to make the simulated oceans and atmosphere warm. The instrument temperature record shows the oceans and surface temperatures have warmed, but those records cannot be used to prove manmade global warming exists. On the other hand, as I have been showing for more that than 3 ½ years, the instrument temperature record can be used to show that most if not all of the warming was caused by natural variables, and as a result, the observational data can be used to invalidate the climate models. If you’re not familiar with my work, refer to my recent post titled A Blog Memo to Kevin Trenberth – NCAR.
With that in mind, all of the following graphs show that high latitude surface temperatures have warmed and that sea ice extent has decreased, but there is no evidence that mankind is responsible for it. More on that later. And that brings us to…
POOR CORRELATION DOES NOT MEAN THERE IS A LACK OF CAUSATION
Of the variables we’ll compare to sea ice extent, high latitude land surface air temperatures correlate worst. Does this mean that warming land surface air temperatures don’t contribute to the variations in sea ice extent? No. Does it mean the loss of sea ice does not cause changes in land surface air temperatures? No. It simply means sea ice extent and land surface air temperatures are varying on different schedules to the many variables the that impact them.
On the other hand, does the relatively high correlation between Arctic sea ice extent and Arctic sea surface temperature indicate the loss of sea ice is more closely related to the warming sea surface temperatures? No. The higher correlation, as noted earlier, is also caused by the fact that sea ice loss results in a greater surface area of open ocean where sea surface temperatures can be measured, and since that water is warmer than the freezing point of sea water, the anomalies in newly opened areas of ocean will have positive anomalies compared to the freezing point, which is the reference for the anomalies.
However, since water has more mass than air, a one deg warming of adjoining sea surface temperatures will have a greater impact on sea ice than a one deg warming of Arctic air. Therefore, since Arctic sea ice is exposed to the North Atlantic, the additional warming of the North Atlantic associated with the Atlantic Multidecadal Oscillation is a major contributor to Arctic sea ice loss regardless of the correlation between the two datasets.
DATA PRESENTATION
All monthly anomaly data in the sea ice comparisons have been standardized; that is, each dataset has been divided by its standard deviation. Since we’re using satellite-based Reynolds OI.v2 for sea surface temperature data, all of the graphs start in November 1981. All of the datasets end in August 2012. The temperature data have also been inverted to accommodate the inverse relationship between sea ice extent and temperature. Base years of 1982 to 2011 were used for anomalies to better align the sea ice data and temperature data when the latter were inverted—the exception is the AMO data. The title blocks of the graphs include the correlation coefficients of the NSIDC Northern Hemisphere sea ice extent and the respective temperature dataset. They have been determined with no lags between the datasets.
ATLANTIC MULTIDECADAL OSCILLATION INDEX
The NSIDC sea ice extent anomalies are compared to the inverted ESRL Atlantic Multidecadal Oscillation Index data in Figure 1. The correlation coefficient is poor at -0.57. There are some periods when the two curves align, and there are others when they don’t. Why doesn’t it correlate better? Arctic sea ice is impacted by North Atlantic sea surface temperatures along one exposure. Sea ice loss on the other side of the Arctic basin is impacted by other variables. Also, the Atlantic Multidecadal Oscillation represents the sea surface temperature anomalies of the entire North Atlantic, not just the portion that comes into contact with Arctic sea ice. We’ll discuss the impact of the Atlantic Multidecadal Oscillation on temperatures in the high latitudes of the Northern Hemisphere and on sea ice extent later in the post.

Figure 1
HIGH LATITUDE LAND SURFACE AIR TEMPERATURE AND LOWER TROPOSPHERE TEMPERATURE ANOMALIES
Figures 2 and 3 compare sea ice extent anomalies to GHCN-CAMS land surface air temperature (LSAT) anomalies and UAH lower troposphere temperature (TLT) anomalies, for the latitudes of 60N-90N. Like the AMO index data, some of the annual and seasonal variations in the curves align, and there are others that don’t. Keep in mind that lower troposphere temperature anomalies represent the temperatures at about 3,000 meters above sea level. Also, the TLT data does stretch across as far north as 85N over the Arctic Ocean, while the land surface air temperature data does not. The correlation coefficient for the land surface air temperature anomalies and sea ice extent is about -0.49, while for the lower troposphere temperatures it’s slightly higher at -0.57. Neither one is very good.

Figure 2
HHHHHHHHHHHHHHHHHHHHHH

Figure 3
HIGH LATITUDE SEA SURFACE TEMPERATURE ANOMALIES
As noted earlier, the best wiggle match presented in this post occurs between the high latitude (60N-90N) sea surface temperature anomalies and the Arctic sea ice extent, Figure 4. The correlation coefficient is -0.85. That’s pretty good for two climate-related variables.
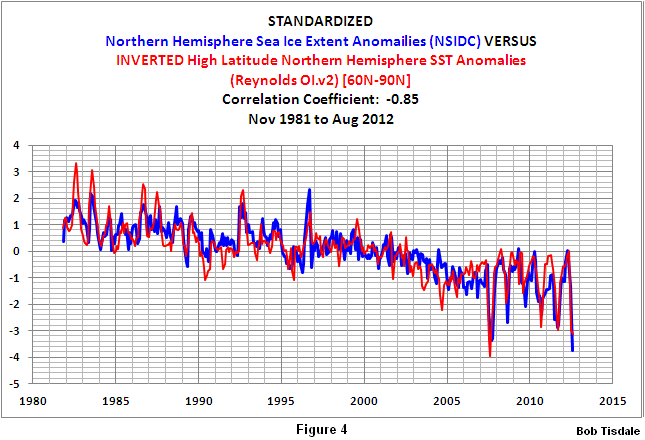
Figure 4
For those interested in that hotspot in the Northwest Atlantic that’s been happening for the past few months, refer to Figure 5. It represents the sea surface temperature anomalies for that portion of the North Atlantic and Arctic Ocean, with the coordinates of 45N-90N, 80W-25W. The best we can say, though, is that the hotspot in the North Atlantic coincided with the high seasonal ice loss this year.

Figure 5
Referring back to our discussion of the Atlantic Multidecadal Oscillation, if we look at the sea surface temperature anomalies for the high latitudes of the North Atlantic (60N-90N, 80W-40E), we see a much improved correlation (-0.71 instead of -0.57 for the AMO). See Figure 6. And again, the North Atlantic directly impacts only one exposure of the Arctic sea ice. With that in mind, the correlation is very good.

Figure 6
NOTES ON THE ATLANTIC MULTIDECADAL OSCILLATION AS PRIMARY CAUSE OF HIGH LATITUDE WARMING AND SEA ICE LOSS
Note: The data is not standardized in the following graphs. They present temperature anomalies.
Many of the posts I’ve written about the Atlantic Multidecadal Oscillation (aka AMO) include a link to the RealClimate glossary about it, where they write:
A multidecadal (50-80 year timescale) pattern of North Atlantic ocean-atmosphere variability whose existence has been argued for based on statistical analyses of observational and proxy climate data, and coupled Atmosphere-Ocean General Circulation Model (“AOGCM”) simulations. This pattern is believed to describe some of the observed early 20th century (1920s-1930s) high-latitude Northern Hemisphere warming and some, but not all, of the high-latitude warming observed in the late 20th century. The term was introduced in a summary by Kerr (2000) of a study by Delworth and Mann (2000).
GISS climate models indicate the majority of the total warming of global surface temperatures over the past 30 years, about 85% (Figure 7), is in response to the warming of the oceans, so one might conclude the additional variability of the North Atlantic has played a major role in the warming of the high latitudes of the Northern Hemisphere. Figure 7 is from Chapter 8.11 of my book Who Turned on the Heat? The data presented in it is from the NASA Goddard Institute for Space Studies (GISS) ModelE Climate Simulations – Climate Simulations for 1880-2003 webpage, specifically Table 3. Those outputs are based on the GISS Model-E coupled general circulation model. They were presented in the Hansen et al (2007) paper Climate simulations for 1880-2003 with GISS modelE.

Figure 7
With that in mind, and referring back to the RealClimate glossary discussion, can we then assume that the multidecadal variability of the North Pacific could also be used to describe “some, but not all, of the high-latitude warming observed in the late 20th century”? Refer to Figure 8. Both datasets in it have been detrended and smoothed with 121-month running-average filters. The intent of Figure 8 is to show that there is a multidecadal signal in the North Pacific, north of 20N, that is not represented by the Pacific Decadal Oscillation index data—that the multidecadal variations in the North Pacific can run in and out of synch with the Atlantic Multidecadal Oscillation—and that the strength of the multidecadal signal in the North Pacific is almost as strong as in the North Atlantic. The multidecadal variations in the North Pacific are normally presented in abstract form as the Pacific Decadal Oscillation, so they are typically overlooked in discussions of the multidecadal variations in Northern Hemisphere land surface air temperatures.

Figure 8
The normal misconception, misinterpretation, misunderstanding, misrepresentation of the Atlantic Multidecadal Oscillation is that it is a form of natural variability that occurs on top of the manmade global warming of the rest of the oceans. The Wikipedia definition of the Atlantic Multidecadal Oscillation begins:
The Atlantic multidecadal oscillation (AMO) was identified by Schlesinger and Ramankutty in 1994.
The AMO signal is usually defined from the patterns of SST variability in the North Atlantic once any linear trend has been removed. This detrending is intended to remove the influence of greenhouse gas-induced global warming from the analysis.
There is no “influence of greenhouse gas-induced global warming” evident in the sea surface temperature records for the past 30 years. We’ve discussed and illustrated this in numerous posts here at Climate Observations over the past 3 ½ years. After the processes El Niño-Southern Oscillation, this was the primary topic of discussion of my book Who Turned on the Heat? – The Unsuspected Global Warming Culprit, El Niño-Southern Oscillation. Here’s an overview:
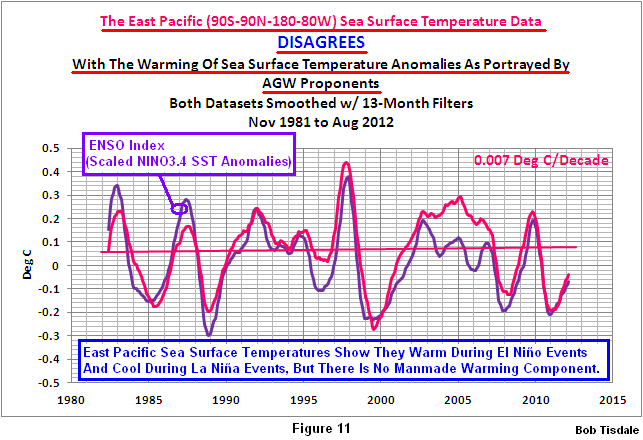
We know that the East Pacific has not warmed in 30 years. Refer to Figure 11 from the post A Blog Memo to Kevin Trenberth – NCAR. I’m going to borrow a few graphs from my recent book.
The South Atlantic-Indian-West Pacific dataset covers the ocean basins not represented by the East Pacific and North Atlantic. The sea surface temperature anomalies of the South Atlantic-Indian-West Pacific only warm during and in response to the strong El Niño events of 1986/87/88 and 1997/98. See Figure 9. There may also have been an upward shift in response to the 2009/10 El Niño but it’s a little early to tell. As you’ll note, the South Atlantic-Indian-West Pacific data cools between the major El Niño events. The trends are negative.

Figure 9
Why are there upward shifts in response to those major El Niño events? Because the South Atlantic-Indian-West Pacific sea surface temperature anomalies do not cool proportionally during the La Niña events that followed them. We can show this by detrending the South Atlantic-Indian-West Pacific data and comparing them to NINO3.4 sea surface temperature anomalies, which are a commonly used index that represents the frequency, strength and duration of ENSO events. Figure 10 is from the blog post here. If the South Atlantic-Indian-West Pacific data cooled proportionally during those La Niña events, its curve would be similar to the East Pacific data, which shows no warming in 30 years.

Figure 10
So far, we have found no evidence of an “influence of greenhouse gas-induced global warming” in the ocean basins that are outside of the North Atlantic. Would the “influence of greenhouse gas-induced global warming” exist only in the North Atlantic? That’s extremely unlikely. Therefore, we can dismiss the consensus opinion that the global oceans are warmed by anthropogenic greenhouse gases.
Let’s take a look at the North Atlantic data. As expected, it shows warming trends between the major El Niño events, Figure 11. But notice how the trend line for the latter period is located above the trend line for the earlier period. That means there was an upward shift in response to the 1997/98 El Niño event.

Figure 11
We can also detrend the North Atlantic sea surface temperature anomalies and compare them to scaled NINO3.4 data to illustrate the cause. The North Atlantic sea surface temperature anomalies also do not cool proportionally in response to the La Niña events that follow the major El Niño events. So the non-linear response of the North Atlantic (and the AMO) to ENSO is a significant portion of the additional warming of the North Atlantic and the subsequent natural sea ice loss in the Arctic.
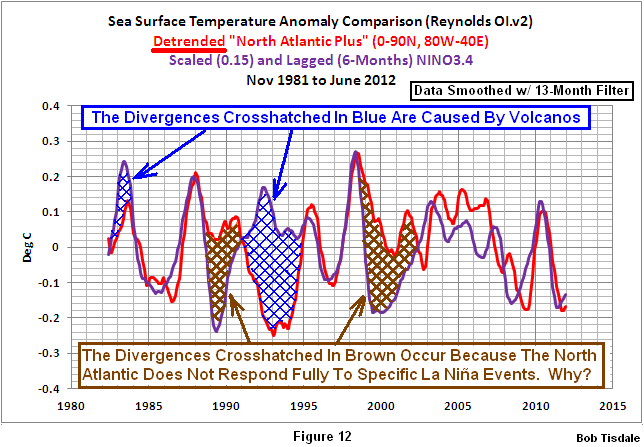
Figure 12
SHAMELESS PLUG
I’ve referenced my recently published e-book (pdf) a number of times in this post. The book is about the phenomena called El Niño and La Niña and its long-term effects. It’s titled Who Turned on the Heat? with the subtitle The Unsuspected Global Warming Culprit, El Niño Southern Oscillation. I do not specifically discuss the loss of Arctic sea ice in the book, but as discussed in this post, those losses are primarily a response to the natural warming of the global oceans.
The book is intended for persons (with or without technical backgrounds) interested in learning about El Niño and La Niña events and in understanding the natural causes of the warming of our global oceans for the past 30 years. Because land surface air temperatures simply exaggerate the natural warming of the global oceans over annual and multidecadal time periods, the vast majority of the warming taking place on land is natural as well. The book is the product of years of research of the satellite-era sea surface temperature data that’s available to the public via the internet. It presents how the data accounts for its warming—and there are no indications the warming was caused by manmade greenhouse gases. None at all.
Who Turned on the Heat? was introduced in the blog post Everything You Ever Wanted to Know about El Niño and La Niña… …Well Just about Everything. The Updated Free Preview includes the Table of Contents; the Introduction; the beginning of Section 1, with the cartoon-like illustrations; the discussion About the Cover; and the Closing.
Please buy a copy. (Paypal or Credit/Debit Card). It’s only US$8.00.
SUMMARY
Since there is no evidence of a manmade component in the warming of the global oceans over the past 30 years, the natural additional warming of the sea surface temperature anomalies of the North Atlantic—above the natural warming of the sea surface temperatures for the rest of the global oceans—has been a major contributor to the natural loss of Arctic sea ice over the satellite era. Add to that the weather events that happen every couple of years and we can pretty much dismiss the hubbub over this year’s record low sea ice in the Arctic basin. Personally, I’d find it comical—if the desperation on the parts of AGW proponents wasn’t so evident. That makes it sad.
SOURCES
With the exception of the ESRL Atlantic Multidecadal Oscillation Index, the data presented in this post is available through the KNMI Climate Explorer.


Hi Bob, I would like to ask you: because you are of different opinions; if you would like to review my post. They keep saying that: peer reviewed text is bias; because is reviewed by people of same thinking and ideas. Me and you see things differently; cannot be accused of any bias. please give your best shot, with honesty; point what’s wrong, whats correct in your opinion :::http://globalwarmingdenier.wordpress.com/2012/09/10/global-temperature/ Thanks in advance!
stefanthedenier: I don’t agree with most of your initial assumptions. The different metrics have different uses and purposes.
Also, it would be helpful if you’d use some type of spell check software. There are so many spelling errors that a person concentrates on them and not the content of your post.
Pingback: On the Record High Sea Surface Temperatures for the Northeast Continental Shelf | Bob Tisdale – Climate Observations
Pingback: Part 1 – Comments on the UKMO Report about “The Recent Pause in Global Warming” | Bob Tisdale – Climate Observations
Pingback: Part 1 – Comments on the UKMO Report about “The Recent Pause in Global Warming” | Watts Up With That?