
NOAA published their State of the Climate Report today for May 2015. Under the heading of Global Summary Information, they note:
Note: With this report and data release, the National Centers for Environmental Information is transitioning to improved versions of its global land (GHCN-M version 3.3.0) and ocean (ERSST version 4.0.0) datasets. Please note that anomalies and ranks reflect the historical record according to these updated versions. Historical months and years may differ from what was reported in previous reports. For more, please visit the associated FAQ and supplemental information.
But of course we know the adjustments that led to the new NOAA ERSST.v4 sea surface temperature data (the biggest changes to the NOAA data took place in the ocean portion) are not supported during the global warming slowdown period by the night marine air temperature dataset (HadNMAT2 from the UKMO) that NOAA used for bias corrections. (See post here.) In other words, it appears NOAA overcooked their “improvements”. Oops!
On the NOAA Global Analysis – May 2015 webpage they state under the heading of Temperatures:
The combined average temperature over global land and ocean surfaces for May 2015 was the highest for May in the 136-year period of record, at 0.87°C (1.57°F) above the 20th century average of 14.8°C (58.6°F), surpassing the previous record set just one year ago by 0.08°C (0.14°F). This ties with February 1998 as the fourth highest monthly departure from average for any month on record. The two highest monthly departures from average occurred earlier this year in February and March, both at 0.89°C (1.60°F) above the 20th century average for their respective months.
Somehow I don’t think that will surprise anyone.
Figure 1 is a graph of the new NOAA Pause-Busting global surface temperature data from January 1979 to May 2015.
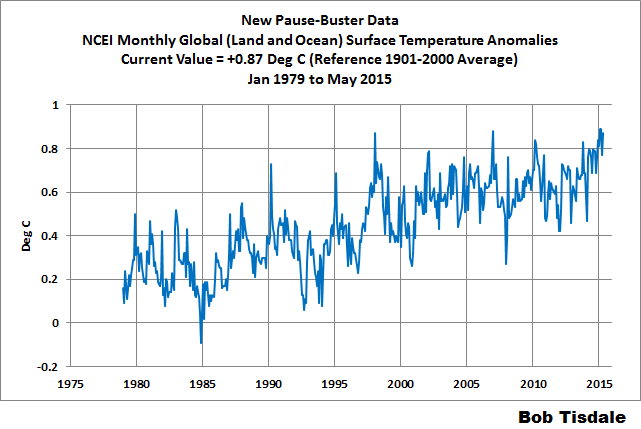
Figure 1
HOW DOES THE PAUSE-BUSTER DATA COMPARE TO THEIR EARLIER DATA FROM NOAA?
Animation 1 compares the new and old NOAA global land+ocean surface temperature data from January 1979 to April 2015, the last month of the old data. The data tweaking had little impact on the multidecadal warming rate.
Animation 1
Animation 2 covers the period of January 2001 to April 2015. It shows that NOAA’s tweaking had a noticeable impact during the 21st Century, almost doubling the warming rate. Again, NOAA can’t justify those higher trends with the night marine air temperature data they used as a reference for the bias adjustments in their sea surface temperature data.
Animation 2
HOW DOES THE PAUSE-BUSTER DATA COMPARE TO THE OTHER GLOBAL DATASETS?
Figure 2 compares the new pause-buster data from NOAA to the global surface temperature products from GISS and UKMO and to the lower troposphere temperature data from RSS and UAH. I’ve used the new Release 6.0 data from UAH in the comparison. The anomalies of all datasets have been referenced to the WMO-preferred base years of 1981-2010.

Figure 2
There are of course differences in how each of the data suppliers handle the polar oceans. As soon as the new NOAA data are available at the KNMI Climate Explorer, I’ll present the comparison using the latitudes of 60S-60N. The new NOAA data should stand out like a sore thumb.
CLOSING
I’ll be using the new NOAA pause-buster data in the future monthly updates, starting next month. In each update from this day forward, I’ll remind everyone that the adjustments that led to the new NOAA sea surface temperature data, where the biggest changes took place, are not supported during the global warming slowdown period by the night marine air temperature dataset (HadNMAT2 from the UKMO) that NOAA used for bias corrections. And as I noted earlier, in other words, it appears NOAA overcooked their “improvements”. Hopefully, others will remind NOAA of that as well.


These criminals in charge have already lost the trust of those of us who know they are acting entirely contrary to disciplined, dispassionate observation and interpretation of the data, and they can only end up tearing apart our country, when the scientific truth finally becomes apparent to the general public only after great trials and tribulations. In the golden age of my youth, I would not have believed it possible, in my time, for authorities to be so universally corrupted and evil in every action. The same goes for the hear-no-evil, see-no-evil, speak-no-evil mass media, who should be on top of such filthy corruption, and name it every time it dares to raise its head. The reason all of our institutions are so suborned is not a mystery, however; it is because there is no valid climate science (because they don’t even know that only local or regional climate can change, while global “climate”–the global mean surface temperature–cannot, to any observable effect, over any timescale of any reasonable relevance to mankind today), and no competent climate scientists (because they all worship false theories and dogmatically ignore and dismiss the definitive contrary evidence).
Thanks, Bob. I like my data raw, not ell-done.
Nice work, Bob.
Malcolm
>
Reblogged this on Climate Collections and commented:
More data adjustments by NOAA.
Pingback: NOAA Alleges New Temperature Data Refutes The “Pause”–But Does It? | Climate Change Sanity
Although these suspicious “adjustments” may make May “warmest month evah” in these records, (which I tend to feel have a political motive), NOAA apparently does not want to feed “adjusted data” into the models they use for their day-to-day forecasts. For day-to-day forecasts they want data that is as close to reality as possible, in the hope their forecasts can beat the forecasts put out by other nations with other models.
What Dr. Ryan Maue does is just use NOAA’s “unadjusted data”, that they use for the GISS model, to graph what the temperatures are up to. And surprise, surprise. May 2015 isn’t even close to being warmest.
Pingback: Both NOAA and GISS Have Switched to NOAA’s Unjustifiably Overcooked “Pause-Busting” Sea Surface Temperature Data for Their Global Temperature Products | Bob Tisdale – Climate Observations
Pingback: Both NOAA and GISS Have Switched to NOAA’s Overcooked “Pause-Busting” Sea Surface Temperature Data for Their Global Temperature Products | Watts Up With That?
Pingback: July 2015 Global Surface (Land+Ocean) and Lower Troposphere Temperature Anomaly & Model-Data Difference Update | Bob Tisdale – Climate Observations
Pingback: July 2015 Global Surface (Land+Ocean) and Lower Troposphere Temperature Anomaly & Model-Data Difference Update | Watts Up With That?
Pingback: July 2015 Global Surface (Land+Ocean) and Lower Troposphere Temperature Anomaly & Model-Data Difference Update | US Issues
Pingback: August 2015 Global Surface (Land+Ocean) and Lower Troposphere Temperature Anomaly & Model-Data Difference Update | Bob Tisdale – Climate Observations
Pingback: August 2015 Global Surface (Land+Ocean) and Lower Troposphere Temperature Anomaly & Model-Data Difference Update | Watts Up With That?
Pingback: September 2015 Global Surface (Land+Ocean) and Lower Troposphere Temperature Anomaly & Model-Data Difference Update | Bob Tisdale – Climate Observations
Pingback: September 2015 Global Surface (Land+Ocean) and Lower Troposphere Temperature Anomaly & Model-Data Difference Update | Watts Up With That?
Pingback: October 2015 Global Surface (Land+Ocean) and Lower Troposphere Temperature Anomaly & Model-Data Difference Update | Bob Tisdale – Climate Observations
Pingback: October 2015 Global Surface (Land+Ocean) and Lower Troposphere Temperature Anomaly & Model-Data Difference Update | Watts Up With That?
Pingback: November 2015 Global Surface (Land+Ocean) and Lower Troposphere Temperature Anomaly & Model-Data Difference Update. | Bob Tisdale – Climate Observations
Pingback: November 2015 Global Surface (Land+Ocean) and Lower Troposphere Temperature Anomaly & Model-Data Difference Update | Watts Up With That?
Pingback: January 2016 Global Surface (Land+Ocean) and Lower Troposphere Temperature Anomaly Update | Bob Tisdale – Climate Observations
Pingback: January 2016 Global Surface (Land+Ocean) and Lower Troposphere Temperature Anomaly Update | Watts Up With That?
Pingback: February 2016 Global Surface (Land+Ocean) and Lower Troposphere Temperature Anomaly Update | Bob Tisdale – Climate Observations
Pingback: February 2016 Global Surface (Land+Ocean) and Lower Troposphere Temperature Anomaly Update | Watts Up With That?
Pingback: March 2016 Global Surface (Land+Ocean) and Lower Troposphere Temperature Anomaly Update | Bob Tisdale – Climate Observations
Pingback: March 2016 Global Surface (Land+Ocean) and Lower Troposphere Temperature Anomaly Update | Watts Up With That?
Pingback: April 2016 Global Surface (Land+Ocean) and Lower Troposphere Temperature Anomaly Update | Bob Tisdale – Climate Observations
Pingback: April 2016 Global Surface (Land+Ocean) and Lower Troposphere Temperature Anomaly Update | Watts Up With That?
Pingback: May 2016 Global Surface (Land+Ocean) and Lower Troposphere Temperature Anomaly Update | Bob Tisdale – Climate Observations
Pingback: May 2016 Global Surface (Land+Ocean) and Lower Troposphere Temperature Anomaly Update | Watts Up With That?
Pingback: June 2016 Global Surface (Land+Ocean) and Lower Troposphere Temperature Anomaly Update | Bob Tisdale – Climate Observations
Pingback: June 2016 Global Surface (Land+Ocean) and Lower Troposphere Temperature Anomaly Update | Watts Up With That?
Pingback: July 2016 Global Surface (Land+Ocean) and Lower Troposphere Temperature Anomaly Update | Bob Tisdale – Climate Observations
Pingback: July 2016 Global Surface (Land+Ocean) and Lower Troposphere Temperature Anomaly Update | Watts Up With That?
Pingback: August 2016 Global Surface (Land+Ocean) and Lower Troposphere Temperature Anomaly Update | Bob Tisdale – Climate Observations
Pingback: August 2016 Global Surface (Land+Ocean) and Lower Troposphere Temperature Anomaly Update | Watts Up With That?
Pingback: September 2016 Global Surface (Land+Ocean) and Lower Troposphere Temperature Anomaly Update | Bob Tisdale – Climate Observations
Pingback: September 2016 Global Surface (Land+Ocean) and Lower Troposphere Temperature Anomaly Update | Watts Up With That?
Pingback: October 2016 Global Surface (Land+Ocean) and Lower Troposphere Temperature Anomaly Update | Watts Up With That?
Pingback: October 2016 Global Surface (Land+Ocean) and Lower Troposphere Temperature Anomaly Update | Bob Tisdale – Climate Observations
Pingback: November 2016 Global Surface (Land+Ocean) and Lower Troposphere Temperature Anomaly Update | Bob Tisdale – Climate Observations
Pingback: November 2016 Global Surface (Land+Ocean) and Lower Troposphere Temperature Anomaly Update | Watts Up With That?
Pingback: December 2016 Global Surface (Land+Ocean) and Lower Troposphere Temperature Anomaly Update – With a Look at the Year-End Annual Results | Bob Tisdale – Climate Observations
Pingback: December 2016 Global Surface (Land+Ocean) and Lower Troposphere Temperature Anomaly Update – With a Look at the Year-End Annual Results | Watts Up With That?
Pingback: September 2018 Global Surface (Land+Ocean) and Lower Troposphere Temperature Anomaly Update | Bob Tisdale – Climate Observations
Pingback: September 2018 Global Surface (Land+Ocean) and Lower Troposphere Temperature Anomaly Update | Watts Up With That?
Pingback: September 2018 Global Surface (Land+Ocean) and Lower Troposphere Temperature Anomaly Update | US Issues
Pingback: October 2018 Global Surface (Land+Ocean) and Lower Troposphere Temperature Anomaly Update | Bob Tisdale – Climate Observations