
MONTHLY SST ANOMALY MAP
The following is a Global map of Reynolds OI.v2 Sea Surface Temperature (SST) anomalies for August 2012. It was downloaded from the NOMADS website. The contour levels are set at 0.5 deg C, and white is set at zero.

August 2012 Sea Surface Temperature (SST) Anomalies Map
(Global SST Anomaly = +0.271 deg C)
MONTHLY OVERVIEW
The Monthly NINO3.4 SST Anomaly continued to warm as one would expect during the evolution of an El Niño (rising about 0.18 deg C) to +0.847 deg C, which is well above the +0.5 Deg C threshold of an El Niño and still well below the +1.0 threshold of a moderate El Niño. See the weekly NINO3.4 graph near the bottom of the post also.
Global Sea Surface Temperature anomalies warmed (+0.037 deg C) as one would expect in response to the developing El Niño. The hemispheres responded differently. The Northern Hemisphere warmed since July, while the Southern Hemisphere was basically unchanged. The South Pacific and the South Atlantic were the only two ocean basins that cooled in August. The monthly Global Sea Surface Temperature anomalies are presently at +0.271 deg C.
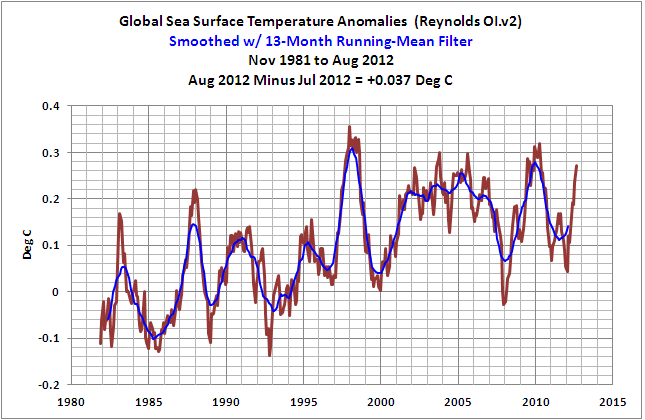
(1) Global Sea Surface Temperature Anomalies
Monthly Change = +0.037 deg C
####################################
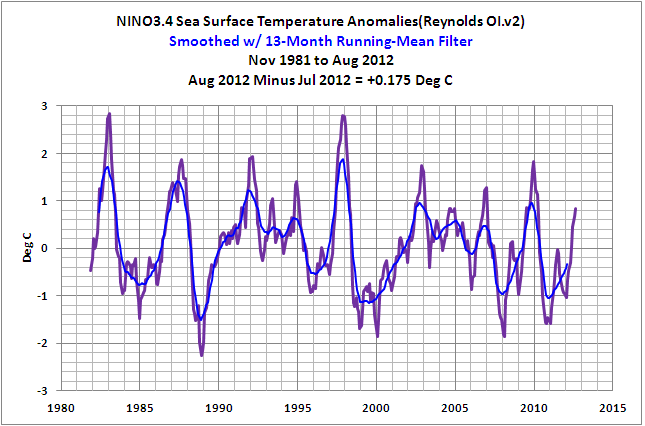
(2) NINO3.4 Sea Surface Temperature Anomalies
(5S-5N, 170W-120W)
Monthly Change = +0.175 deg C
####################################
THE EAST PACIFIC VERSUS THE REST OF THE WORLD
The East Pacific and the Rest-Of-The-World (Atlantic-Indian-West Pacific) datasets were first discussed in the post Sea Surface Temperature Anomalies – East Pacific Versus The Rest Of The World, and was discussed a few months later in How Can Things So Obvious Be Overlooked By The Climate Science Community?
It was also discussed in great detail in my recently published book Who Turned on the Heat? The Unsuspected Global Warming Culprit, El Niño-Southern Oscillation. The Updated Free Preview (typos corrected) includes the Table of Contents; the Introduction; the beginning of Section 1, with the cartoon-like illustrations; the discussion About the Cover; and the Closing. Also see the blog post Everything You Every Wanted to Know about El Niño and La Niña… for an overview. The book is only US$8.00. Please click here to buy a copy. (Paypal or Credit/Debit Card).
In the following two graphs, both datasets have been adjusted for the impacts of volcanic aerosols. The global oceans were divided into these two subsets to illustrate two facts. First, the linear trend of the volcano-adjusted East Pacific (90S-90N, 180-80W) Sea Surface Temperature anomalies since the start of the Reynolds OI.v2 dataset is basically flat. That is, the East Pacific hasn’t warmed in 30+ years. The East Pacific linear trend varies very slightly with each monthly update. But it won’t vary significantly between El Niño and La Niña events.

(3) Volcano-Adjusted East Pacific Sea Surface Temperature (SST) Anomalies
(90S-90N, 180-80W)
####################################
And second, the volcano-adjusted Sea Surface Temperature anomalies for the Rest of the World (90S-90N, 80W-180) rise in very clear steps, in response to the significant 1986/87/88 and 1997/98 El Niño/La Niña events. It also appears as though the Sea Surface Temperature anomalies of this dataset may have made another upward shift in response to the 2009/10 El Niño and 2010/11 La Niña events. For those who are interested in the actual trends of the Sea Surface Temperature anomalies between the 1986/87/88 and 1997/98 El Niño events and between the 1997/98 and 2009/10 El Niño events refer to Figure 4 in Does The Sea Surface Temperature Record Support The Hypothesis Of Anthropogenic Global Warming? I further described (at an introductory level) the ENSO-related processes that cause these upward steps in the post ENSO Indices Do Not Represent The Process Of ENSO Or Its Impact On Global Temperature.

(4) Volcano-Adjusted Sea Surface Temperature Anomalies For The Rest of the World
(90S-90N, 80W-180)
####################################
The periods used for the average Rest-Of-The-World Sea Surface Temperature anomalies between the significant El Niño events of 1982/83, 1986/87/88, 1997/98, and 2009/10 are determined as follows. Using the original NOAA Oceanic Nino Index (ONI)for the official months of those El Niño events, I shifted (lagged) those El Niño periods by six months to accommodate the lag between NINO3.4 SST anomalies and the response of the Rest-Of-The-World Sea Surface Temperature anomalies, then deleted the Rest-Of-The-World data that corresponds to those significant El Niño events. I then averaged the Rest-Of-The-World SST anomalies between those El Niño-related gaps.
The “Nov 2010 to Present” average varies with each update. As noted in the post Sea Surface Temperature Anomalies – East Pacific Versus The Rest Of The World, it will be interesting to see where that Sea Surface Temperature anomaly average settles out, if it does, before the next significant El Niño drives them higher.
Of course, something could shift. Will the upward ratcheting continue when the Atlantic Multidecadal Oscillation (AMO) decides to turn around and start its decline? The upward steps would not continue in the North Atlantic, but would the AMO impact the upward steps in other portions of the globe? For more information about the Atlantic Multidecadal Oscillation, refer to the post An Introduction To ENSO, AMO, and PDO — Part 2.
The Sea Surface Temperature anomalies of the East Pacific Ocean, or approximately 33% of the surface area of the global oceans, have decreased slightly since 1982 based on the linear trend. And between upward shifts, the Sea Surface Temperature anomalies for the rest of the world (67% of the global ocean surface area) remain relatively flat. As discussed in my book, anthropogenic forcings are said to be responsible for most of the rise in global surface temperatures over this period, but the Sea Surface Temperature anomaly graphs of those two areas prompt a two-part question: Since 1982, what anthropogenic global warming processes would overlook the Sea Surface Temperatures of 33% of the global oceans and have an impact on the other 67% but only during the months of the significant El Niño events of 1986/87/88, 1997/98 and 2009/10?
STANDARD NOTE ABOUT THE DATA
The MONTHLY graphs illustrate raw monthly OI.v2 SEA SURFACE TEMPERATURE anomaly data from November 1981 to August 2012, as it is presented by the NOAA NOMADS website linked at the end of the post. I’ve added the 13-month running-average filter to smooth out the seasonal variations.
MONTHLY INDIVIDUAL OCEAN AND HEMISPHERIC SEA SURFACE TEMPERATURE UPDATES
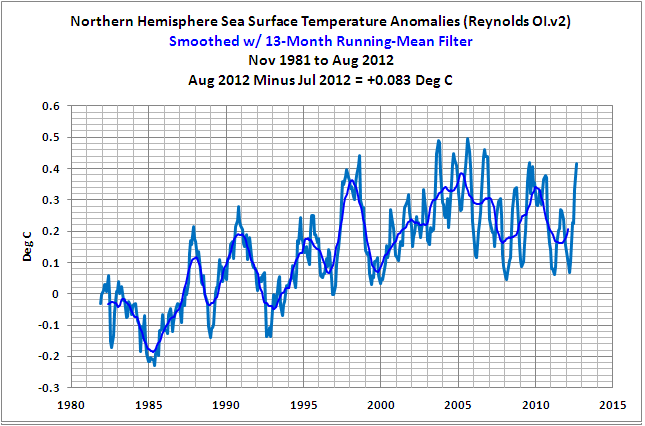
(5) Northern Hemisphere Sea Surface Temperature (SST) Anomalies
Monthly Change = +0.083 deg C
####################################

(6) Southern Hemisphere Sea Surface Temperature (SST) Anomalies
Monthly Change = +0.001 deg C
####################################

(7) North Atlantic Sea Surface Temperature (SST) Anomalies
(0 to 70N, 80W to 0)
Monthly Change = +0.180 deg C
####################################
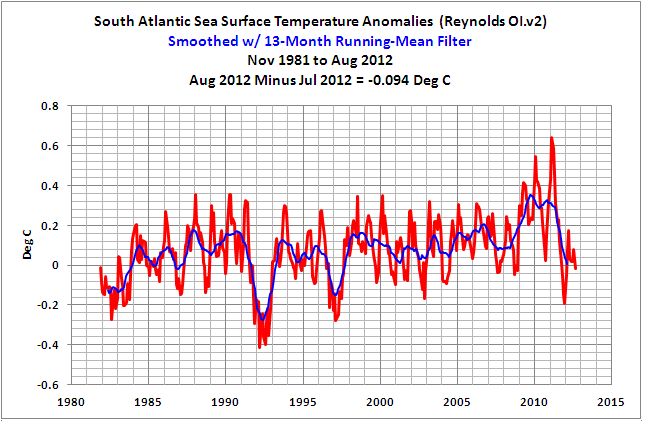
(8) South Atlantic Sea Surface Temperature (SST) Anomalies
(0 to 60S, 70W to 20E)
Monthly Change = -0.094 deg C
Note: I discussed the (now apparently temporary) upward shift in the South Atlantic Sea Surface Temperature anomalies in the post The 2009/10 Warming Of The South Atlantic. Prior to that shift, the South Atlantic sea surface temperature anomalies had been relatively flat for about two decades. It looks as though the South Atlantic sea surface temperature anomalies are returning to the level they were at before that surge, and where they had been since the late 1980s. We’ll have to see where things settle.
####################################

(9) North Pacific Sea Surface Temperature (SST) Anomalies
(0 to 65N, 100E to 90W)
Monthly Change = +0.027 Deg C
####################################

(10) South Pacific Sea Surface Temperature (SST) Anomalies
(0 to 60S, 120E to 70W)
Monthly Change = -0.008 deg C
####################################

(11) Indian Ocean Sea Surface Temperature (SST) Anomalies
(60S to 30N, 20E to 120E)
Monthly Change = +0.121 deg C
####################################
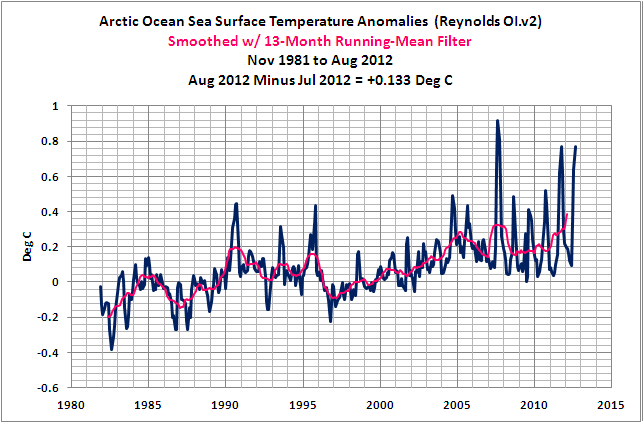
(12) Arctic Ocean Sea Surface Temperature (SST) Anomalies
(65N to 90N)
Monthly Change = +0.133 deg C
####################################
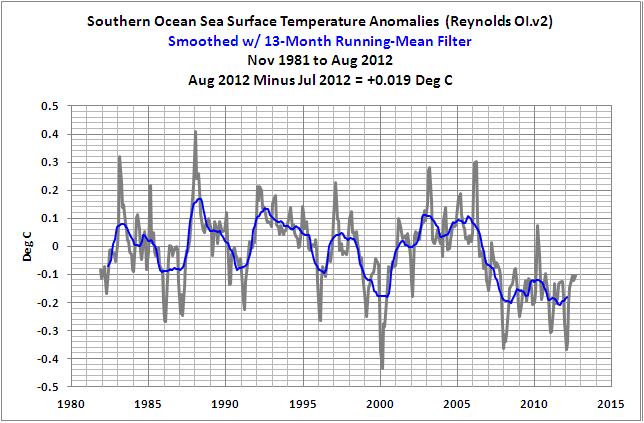
(13) Southern Ocean Sea Surface Temperature (SST) Anomalies
(90S-60S)
Monthly Change = +0.019 deg C
####################################
WEEKLY SEA SURFACE TEMPERATURE ANOMALIES
The NINO3.4 Sea Surface Temperature anomalies based on the week centered on August 5, 2012 dropped back down into weak El Niño range. They are presently at +0.881 deg C.

(14) Weekly NINO3.4 Sea Surface Temperature (SST) Anomalies
####################################
The weekly global Sea Surface Temperature anomalies are wiggling their way warmer in response to the seasonal ENSO signal and are at +0.276 deg C.
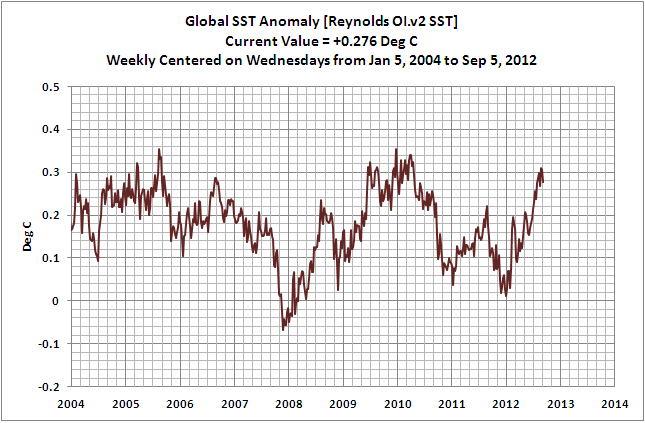
(15) Weekly Global Sea Surface Temperature (SST) Anomalies
####################################
INTERESTED IN LEARNING MORE ABOUT THE EL NIÑO AND LA NIÑA AND THEIR LONG-TERM EFFECTS ON GLOBAL SEA SURFACE TEMPERATURES?
Why should you be interested? The sea surface temperature record indicates El Niño and La Niña events are responsible for the warming of global sea surface temperature anomalies over the past 30 years, not manmade greenhouse gases. Scroll back up to the discussion of the East Pacific versus the Rest of the World. I’ve searched sea surface temperature records for more than 4 years, and I can find no evidence of an anthropogenic greenhouse gas signal.
I’ve recently published my e-book (pdf) about the phenomena called El Niño and La Niña. It’s titled Who Turned on the Heat? with the subtitle The Unsuspected Global Warming Culprit, El Niño Southern Oscillation. It is intended for persons (with or without technical backgrounds) interested in learning about El Niño and La Niña events and in understanding the natural causes of the warming of our global oceans for the past 30 years. Because land surface air temperatures simply exaggerate the natural warming of the global oceans over annual and multidecadal time periods, the vast majority of the warming taking place on land is natural as well. The book is the product of years of research of the satellite-era sea surface temperature data that’s available to the public via the internet. It presents how the data accounts for its warming—and there are no indications the warming was caused by manmade greenhouse gases. None at all.
Who Turned on the Heat? was introduced in the blog post Everything You Ever Wanted to Know about El Niño and La Niña… …Well Just about Everything. The Updated Free Preview (typos corrected) includes the Table of Contents; the Introduction; the beginning of Section 1, with the cartoon-like illustrations; the discussion About the Cover; and the Closing.
Please click here to buy a copy. (Paypal or Credit/Debit Card). It’s only US$8.00.
You’re probably asking yourself why you should spend $8.00 for a book written by an independent climate researcher. There aren’t many independent researchers investigating El Niño-Southern Oscillation or its long-term impacts on global surface temperatures. In fact, if you were to perform a Google image search of NINO3.4 sea surface temperature anomalies, the vast majority of the graphs and images are from my blog posts. Try it. Cut and paste NINO3.4 sea surface temperature anomalies into Google. Click over to images and start counting the number of times you see Bob Tisdale.
By independent I mean I am not employed in a research or academic position; I’m not obligated to publish results that encourage future funding for my research—that is, my research is not agenda-driven. I’m a retiree, a pensioner. The only funding I receive is from book sales and donations at my blog. Also, I’m independent inasmuch as I’m not tied to consensus opinions so that my findings will pass through the gauntlet of peer-review gatekeepers. Truth be told, it’s unlikely the results of my research would pass through that gauntlet because the satellite-era sea surface temperature data contradicts the tenets of the consensus.
SOURCES
The Sea Surface Temperature anomaly data used in this post is available through the NOAA NOMADS website:
http://nomad1.ncep.noaa.gov/cgi-bin/pdisp_sst.sh
or:


Bob,
I have purchased the book today and look forward to reading it during my autumn holidays next week. As per your North Atlantic graph, local Scottish temperatures, and weather, improved markedly for about 4 weeks. This ended last week and today cold westerlies have arrived, with the jetstream headed south again.
John Costigane: Thanks and anjoy your holidays.
Record Breaking La Nina events 2010-2012?????
http://www.bom.gov.au/climate/enso/history/ln-2010-12/?ref=ad
About half way through your book so far Bob, have you found any good references for UK,European weather patterns related to ENSO particularly to the northern jet stream? All the map representations from the links provided have us out on the top corners without much representation. It would be interesting to see jet stream patterns over Europe related to a 2-3 month lag from NINO3.4
Hi Lord Beaverbrook: The best I can come up with are the KNMI web pages showing the impacts on global weather, including Europe, which is linked in the book, possibly ahead of where you are now:
http://www.knmi.nl/research/global_climate/enso/effects/
And the presentation by a member of ECMWF (Adam Scaife) about ENSO impacts on Europe:
Click to access Scaife.pdf
And there’s also an earlier presentation by Ineson and Scaife:
Click to access ineson.pdf
I’ll agree regarding “Record Breaking La Nina events 2010-2012?????”
Someone at BOM was impressed with a double-dip La Nina.
Thanks for the link to Scaife presentation that was excellent.
Sorry to trouble you further with what might be a dumb question, but the topic is intriguing, so any thoughts on whether this could influence ENSO this winter?
http://news.sky.com/story/984887/thousands-flee-as-guatemalan-volcano-erupts
Lord Beaverbrook: The eruption doesn’t appear to have been large enough to be able to offset an El Nino, even a minor one.
Is there any known reason why SSTs on the USA/Canada border in the Arctic are so hot at present?
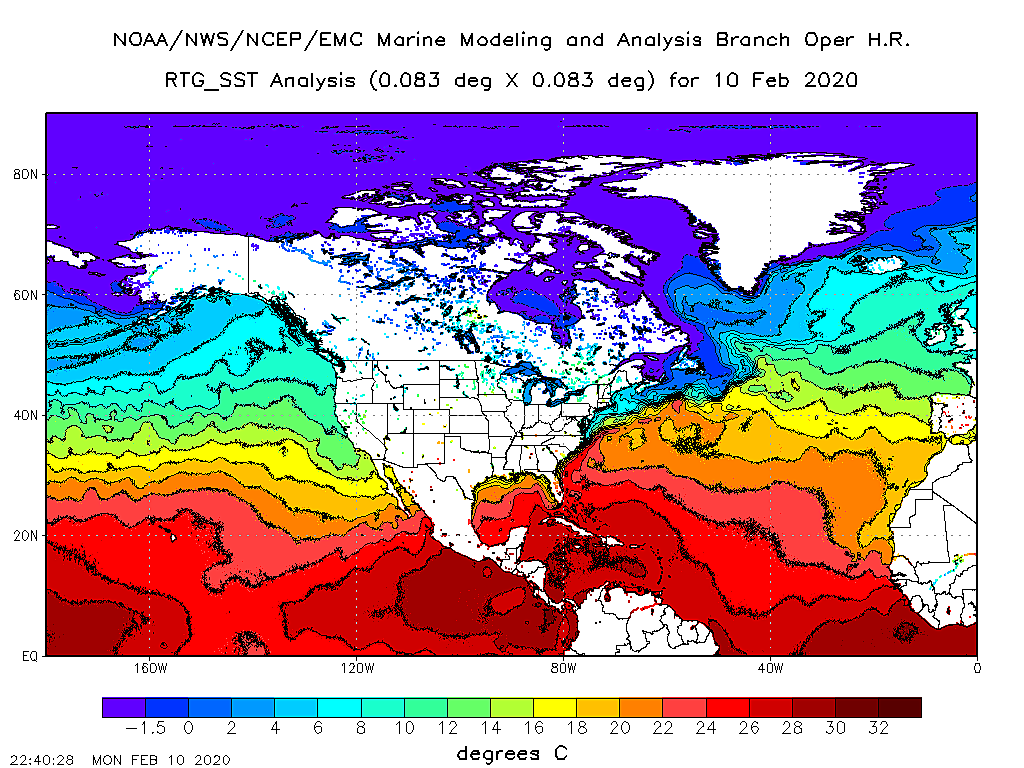
Look at this temperature SST plot and the semi-circle of warm, even hot, sea water on the border.
Is it just a wave of quite hot water that came up from the Pacific and is now disapating or could there be some other cause?
Richard: Did you mean to link a sea surface temperature map?
Or an anomaly map like:
http://www.eldersweather.com.au/climimage.jsp?i=sstag
Because they don’t look exceptionally warm in terms of anomalies. In fact, the anomalies for the Bering Sea are primarily negative
If you are discussing SST and not SSTanomalies, the seasonal component of Northern Hemisphere sea surface temperatures typically peak in September. There’s about a 3-month lag with the actual seasons.
Yes I did mean to link to an SST rather than an anomaly one, but both show a very odd distribution around the Alaska/Canada border in the Beaufort Sea.
I realise that this thread is dealing with long term cycles rather than current observations so this is rather out of place here but I couldn’t think of where else to ask it.
Pingback: wetter and drier, warmer and hotter … | pindanpost