
In the 2012 State of the Climate Report, the National Oceanic and Atmospheric Administration (NOAA) stated (my boldface):
2012 ranked as the warmest “La Niña year”, surpassing the previous record set in 2011. Two of the three warmest years on record (2010 and 1998) are “El Niño years”. A La Niña (El Niño) year is defined here as occurring when the first three months of a calendar year meet the La Niña (El Niño) criteria as defined by the CPC.
Nonsense!!!
NOAA provided a lovely graph to illustrate their erroneous claim, which I’ve annotated and included here as Figure 1. The original is here. Unfortunately for NOAA, they must’ve conveniently forgotten that they revised their Oceanic NINO Index (ONI) in 2012, and that now 2006 is now considered a La Niña year. Oops!! According to the NOAA graph, 2006 was considerably warmer than 2012. And we can confirm that by looking at the annual global temperature anomalies presented by NOAA here.
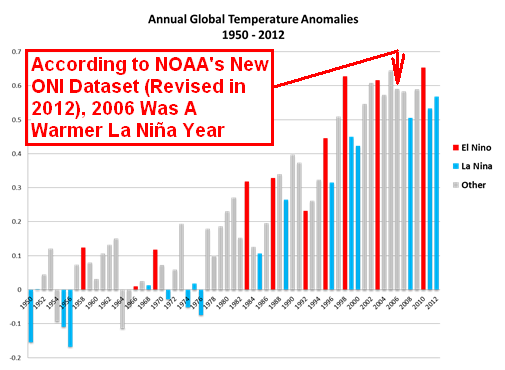
Figure 1
A screen cap of the new and improved ONI dataset is provided in Figure 2.

Figure 2
And a screen cap of the old version is provided in Figure 3. If NOAA had extended the 2012 data of their original and better version of their ONI dataset, 2012 would not have qualified as a La Niña year.

Figure 3
NOAA: If you make the correction to your State of the Climate report, please provide a link to this post. Thank you.
NOAA ONI IS NO LONGER A SEA SURFACE TEMPERATURE ANOMALY DATASET
As a reminder, we discussed and illustrated in the blog post Comments on NOAA’s Recent Changes to the Oceanic NINO Index (ONI) how NOAA’s ONI is no longer a sea surface temperature anomaly dataset, with a fixed set of base years. Therefore, you must exercise extreme caution if you intend to use in any analysis. It can and will give you odd results, because they’ve eliminated the effect of the 1976 Pacific Climate Shift on the ONI data.
INTERESTED IN LEARNING MORE ABOUT THE EL NIÑO AND LA NIÑA AND THEIR LONG-TERM EFFECTS ON GLOBAL SEA SURFACE TEMPERATURES?
Why should you be interested? NOAA also conveniently overlooked the fact that their own datasets indicate El Niño and La Niña events, not manmade greenhouse gases, are responsible for the warming of global sea surface temperature anomalies over the past 30 years and the warming of ocean heat content in the tropics since 1955. I’ve searched sea surface temperature records and ocean heat content data for more than 4 years (more than 3 years for the ocean heat content data), and I can find no evidence of an anthropogenic greenhouse gas signal. That is, the warming of the global oceans has been caused by Mother Nature, not anthropogenic greenhouse gases.
I’ve recently published my e-book (pdf) about the phenomena called El Niño and La Niña. It’s titled Who Turned on the Heat? with the subtitle The Unsuspected Global Warming Culprit, El Niño Southern Oscillation. It is intended for persons (with or without technical backgrounds) interested in learning about El Niño and La Niña events and in understanding the natural causes of the warming of our global oceans for the past 31 years. Because land surface air temperatures simply exaggerate the natural warming of the global oceans over annual and multidecadal time periods, the vast majority of the warming taking place on land is natural as well. The book is the product of years of research of the satellite-era sea surface temperature data that’s available to the public via the internet. It presents how the data accounts for its warming—and there are no indications the warming was caused by manmade greenhouse gases. None at all.
Who Turned on the Heat? was introduced in the blog post Everything You Ever Wanted to Know about El Niño and La Niña… …Well Just about Everything. The Updated Free Preview includes the Table of Contents; the Introduction; the beginning of Section 1, with the cartoon-like illustrations; the discussion About the Cover; and the Closing.
Please buy a copy. Credit/Debit Card through PayPal. You do NOT need to open a PayPal account. Simply scroll down to the “Don’t Have a PayPal Account” purchase option. It’s only US$8.00.


2009 was a La Nina-year, too, because the ONI-values were at -0,5 and colder…, in both versions…
Thanks for Your good work from good old Germany
Rolf
Rolf, in order for NOAA to consider it to be a full-fledged “official” La Nina, the ONI values must remain at -0.5 deg C or cooler for 5 consecutive “months”, where each month presents a 3-month average.
Pingback: The Manmade Global Warming Challenge | Bob Tisdale – Climate Observations
Pingback: New ebook: The Manmade Global Warming Challenge | Watts Up With That?
Pingback: NOAA Corrects Their 2012 State of the Climate Report – 2012 Was NOT the Warmest La Niña Year on Record | Bob Tisdale – Climate Observations
Pingback: NOAA corrects ‘State of the Climate’ – offers no credit | Watts Up With That?
Pingback: NOAA corrects ‘State of the Climate’ – Offers No Credit « Tarpon's Swamp
Pingback: NOAA’s Ever-Changing Definition of La Niña Years | Bob Tisdale – Climate Observations
Pingback: NOAA’s Ever-Changing Definition of La Niña Years | Watts Up With That?