
We used NOAA’s CAMS-OPI satellite-era precipitation data in the post Model-Data Precipitation Comparison: CMIP5 (IPCC AR5) Model Simulations versus Satellite-Era Observations. Unfortunately, we weren’t able to isolate precipitation data for land and oceans with that dataset at the KNMI Climate Explorer. But there is another satellite-era precipitation dataset available at the KNMI Climate Explorer, and it is available with land and ocean masks. It’s NOAA’s Global Precipitation Climatology Project (GCPC) Version 2.2. Like the CAMS-OPI data, the GCPC v2.2 precipitation data is based on satellite and rain gauge observations.
Figure 1 compares the GCPC v2.2 precipitation anomalies for global land and ocean surfaces. The dataset starts in January 1979 and ends in February 2013. Both land and ocean precipitation anomalies have been smoothed with 13-month running average filters to suppress the monthly variability. Looking at the global ocean precipitation anomalies (red curve), it’s blatantly obvious that the primary causes of annual precipitation variations are El Niño and La Niña events. The 1982/83, 1986/87/88, 1997/98 and 2009/10 El Niño events are plainly visible, and you can also make out the lesser El Ninos in the early 1990s and mid-2000s. The trailing La Niñas are also evident.

Figure 1
The opposing relationship between ocean precipitation and land surface precipitation is also obvious. Land surface precipitation generally drops in response to El Niños and increases during La Niñas. There is also a strong dip and rebound in the land surface precipitation data starting about 1991 that may be a response to the eruption of Mount Pinatubo. Curiously, the ocean data does not show a similar response.
There also appear to be other factors contributing to the longer-term variations. The Atlantic Multidecadal Oscillation, the Pacific Decadal Oscillation, the Indian Ocean Dipole, and other coupled ocean-atmosphere processes are the likely suspects. But El Niño-Southern Oscillation (ENSO) is one of the primary factors governing precipitation and the water cycle on this planet, if not the primary factor.
And what can’t climate models simulate? ENSO. For further information about climate models failings when trying to simulate ENSO, refer to Guilyardi et al (2009). Climate models also can’t simulate Atlantic Multidecadal Oscillation, the Pacific Decadal Oscillation, the Indian Ocean Dipole, and other coupled ocean-atmosphere processes.
I thought of ending the post there. There really is no need to continue. But for those interested, Figures 2 and 3 compare the CMIP5-archived models to the land surface precipitation anomalies and the precipitation data over the oceans. Ocean and land masks are available through the KNMI Climate Explorer for the model outputs as well. As noted in the title blocks, we’re using the multi-model ensemble member mean of all of the models in the CMIP5 archive. As with the other model-data comparisons, were using RCP6.0 because it is the most similar to the widely used A1B scenario from earlier modeling efforts. And as a reminder, the models in the CMIP5 archive are being used by the IPCC for their upcoming 5th Assessment Report.
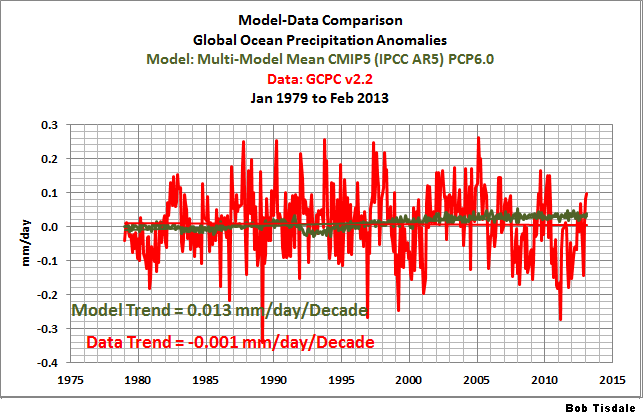
Figure 2
########
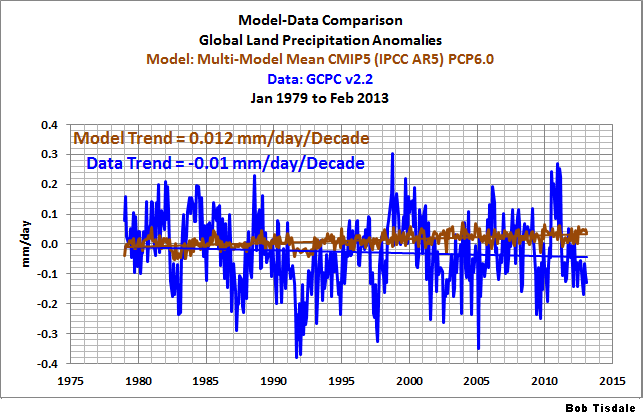
Figure 3
The climate models simulate increases in precipitation over both land and ocean surfaces, and the rates are very similar. But the data shows basically no long-term trend over the oceans and a decline over land. In more basic terms, according to the climate models, if manmade greenhouse gases were responsible for the changes in precipitation over the past few decades, precipitation over land surfaces would have increased, but the data show it has declined.
STANDARD BLURB ABOUT THE USE OF THE MODEL MEAN (With a Minor Addition that’s Underlined)
We’ve published numerous posts that include model-data comparisons. If history repeats itself, proponents of manmade global warming will complain in comments that I’ve only presented the model mean in the above graphs and not the full ensemble. In an effort to suppress their need to complain once again, I’ve borrowed parts of the discussion from the post Blog Memo to John Hockenberry Regarding PBS Report “Climate of Doubt”.
The model mean provides the best representation of the manmade greenhouse gas-driven scenario—not the individual model runs, which contain noise created by the models. For this, I’ll provide two references:
The first is a comment made by Gavin Schmidt (climatologist and climate modeler at the NASA Goddard Institute for Space Studies—GISS). He is one of the contributors to the website RealClimate. The following quotes are from the thread of the RealClimate post Decadal predictions. At comment 49, dated 30 Sep 2009 at 6:18 AM, a blogger posed this question:
If a single simulation is not a good predictor of reality how can the average of many simulations, each of which is a poor predictor of reality, be a better predictor, or indeed claim to have any residual of reality?
Gavin Schmidt replied with a general discussion of models:
Any single realisation can be thought of as being made up of two components – a forced signal and a random realisation of the internal variability (‘noise’). By definition the random component will uncorrelated across different realisations and when you average together many examples you get the forced component (i.e. the ensemble mean).
To paraphrase Gavin Schmidt, we’re not interested in the random component (noise) inherent in the individual simulations; so we use the average because we’re interested in the forced component, which represents the modeler’s best guess of the effects of manmade greenhouse gases on the variable being simulated.
The quote by Gavin Schmidt is supported by a similar statement from the National Center for Atmospheric Research (NCAR). I’ve quoted the following in numerous blog posts and in my recently published ebook. Sometime over the past few months, NCAR elected to remove that educational webpage from its website. Luckily the Wayback Machine has a copy. NCAR wrote on that FAQ webpage that had been part of an introductory discussion about climate models (my boldface):
Averaging over a multi-member ensemble of model climate runs gives a measure of the average model response to the forcings imposed on the model. Unless you are interested in a particular ensemble member where the initial conditions make a difference in your work, averaging of several ensemble members will give you best representation of a scenario.
In summary, we are definitely not interested in the models’ internally created noise, and we are not interested in the results of individual responses of ensemble members to initial conditions. So, in the graphs, we exclude the visual noise of the individual ensemble members and present only the model mean, because the model mean is the best representation of how the models are programmed and tuned to respond to manmade greenhouse gases.
CLOSING
We can add global precipitation anomalies over land and over the oceans to the growing list of climate model failures. The others included:
Greenland and Iceland Land Surface Air Temperature Anomalies
Scandinavian Land Surface Air Temperature Anomalies
Alaska Land Surface Air Temperatures
Daily Maximum and Minimum Temperatures and the Diurnal Temperature Range
Satellite-Era Sea Surface Temperatures
Global Surface Temperatures (Land+Ocean) Since 1880
And we recently illustrated and discussed in the post Meehl et al (2013) Are Also Looking for Trenberth’s Missing Heat that the climate models used in that study show no evidence that they are capable of simulating how warm water is transported from the tropics to the mid-latitudes at the surface of the Pacific Ocean, so why should we believe they can simulate warm water being transported to depths below 700 meters without warming the waters above 700 meters?
Surface temperatures and precipitation are the two primary metrics that interest humans. Will the future be warmer or cooler? And will it be wetter or drier? Climate models show no skill at being able to answer those two fundamental questions about climate change.


Another excellent article, Mr. Tisdale, proving, once again, that the Earth magnificently CONTROLS ITSELF (along with its Inventor’s occasional direct tuning).
Thanks, Janice.
Regards
Pingback: No Consensus among Three Global Precipitation Datasets | Bob Tisdale – Climate Observations
Pingback: No Consensus among Three Global Precipitation Datasets | Watts Up With That?
Pingback: Part 1 – Comments on the UKMO Report about “The Recent Pause in Global Warming” | Bob Tisdale – Climate Observations
Pingback: Part 1 – Comments on the UKMO Report about “The Recent Pause in Global Warming” | Watts Up With That?
Pingback: The Deepest, Scariest Secrets of the Post Office Scandal Revealed | Tennesseans Watching Federal & State Government
Pingback: Open Letter to Lewis Black and George Clooney | Bob Tisdale – Climate Observations
Pingback: Open Letter to Lewis Black and George Clooney | Watts Up With That?
Pingback: Socialism and Electric Cars: Failures for Five Generations and Sponsored by Democrats Everywhere
Pingback: The 2014/15 El Niño – Part 6 – What’s All The Hubbub About?… | Bob Tisdale – Climate Observations
Pingback: The 2014/15 El Niño – Part 6 – What’s All The Hubbub About?… | Watts Up With That?
Pingback: California Drought – A Novel Statistical Analysis of Unrealistic Climate Models and of a Reanalysis That Should Not Be Equated with Reality | Bob Tisdale – Climate Observations
Pingback: California Drought – A Novel Statistical Analysis of Unrealistic Climate Models and of a Reanalysis That Should Not Be Equated with Reality | Watts Up With That?
Pingback: On the Elusive Absolute Global Mean Surface Temperature – A Model-Data Comparison | Bob Tisdale – Climate Observations
Pingback: On the Elusive Absolute Global Mean Surface Temperature – A Model-Data Comparison | Watts Up With That?
Pingback: Open Letter to U.S. Senators Ted Cruz, James Inhofe and Marco Rubio | Bob Tisdale – Climate Observations
Pingback: Open Letter to U.S. Senators Ted Cruz, James Inhofe and Marco Rubio | Watts Up With That?
Pingback: What Animals Are Likely to Go Extinct First Due to Climate Change? | Bob Tisdale – Climate Observations
Pingback: What Animals Are Likely to Go Extinct First Due to Climate Change? | Watts Up With That?