
UPDATE: Corrected the percentage of ocean heat loss though evaporation. Update 2: I added a link to a post by Willis Eschenbach at the end, and I corrected a typo.
# # #
Ocean heat content and vertically averaged temperature data for the oceans have been the subjects of a couple of recent blog posts. As one might expect, the discussions on those threads tend to shift to the subject of whether or not the infrared (longwave) radiation from manmade greenhouse gases can cause any measureable ocean warming at the surface or at depth. According to the hypothesis of human-induced global warming, the warming of the global oceans to depth and the related ocean heat uptake are a function of the radiative imbalance caused by manmade greenhouse gases. There are a number of arguments for and against the hypothetical anthropogenic warming of the oceans.
So the topic of this post is ocean warming. I’ll present different opinions/arguments on anthropogenic ocean warming.
For a detailed overview of ocean heat content data, please see the post Is Ocean Heat Content Data All It’s Stacked Up to Be? And see the post AMAZING: The IPCC May Have Provided Realistic Presentations of Ocean Heat Content Source Data for another discussion by the IPCC.
INFRARED RADIATION CAN ONLY PENETRATE THE TOP FEW MILLIMETERS OF THE OCEAN SURFACE AND THAT’S WHERE EVAPORATION TAKES PLACE
It is often argued that infrared radiation from manmade greenhouse gases can only penetrate the top few millimeters of the ocean surface and that’s where evaporation occurs. That argument then continues that additional infrared radiation from anthropogenic greenhouse gases can only add to surface evaporation, and cannot heat the oceans. On the other hand, sunlight reaches into the oceans to depths of 100 meters or so, though most of it is absorbed in the top 10 meters. Even so, sunlight’s ability to warm the oceans is many orders of magnitude greater than infrared radiation. One of my earliest memories of this argument came from Robert E. Stevenson’s (Oceanographer Scripps) 2000 article Yes, the Ocean Has Warmed; No, It’s Not ‘Global Warming’. In April of this year, looking for solid answers on this topic, Roy Spencer presented the same arguments and a few counter arguments in his post, Can Infrared Radiation Warm a Water Body?
Field tests reported in the 2006 post Why greenhouse gases warm the oceans at RealClimate are often cited by those who believe infrared radiation is responsible for ocean warming. That guest post by Peter Minnett of the University of Miami includes:
However, some have insisted that there is a paradox here – how can a forcing driven by longwave absorption and emission impact the ocean below since the infrared radiation does not penetrate more than a few micrometers into the ocean?
So this argument was considered by climate scientists. The post then goes on to describe why it’s not an inconsistency and then to present the results of field tests. My Figure 1 is Figure 2 from that RealClimate post.

Figure 1 – The change in the skin temperature to bulk temperature difference as a function of the net longwave [infrared] radiation.
The summary text for the illustration at RealClimate reads:
There is an associated reduction in the difference between the 5 cm and the skin temperatures. The slope of the relationship is 0.002ºK (W/m2)-1. Of course the range of net infrared forcing caused by changing cloud conditions (~100W/m2) is much greater than that caused by increasing levels of greenhouse gases (e.g. doubling pre-industrial CO2 levels will increase the net forcing by ~4W/m2), but the objective of this exercise was to demonstrate a relationship.
That, however, creates a counter argument that has been discussed by others. See the HockeySchtick post RealClimate admits doubling CO2 could only heat the oceans 0.002ºC at most. Let me put this into more recent terms. According to the NOAA Annual Greenhouse Gas Index, infrared radiation has only increased about 1.2 watts/meter^2 from 1979 to 2013. Based on the findings at RealClimate, that rise in infrared radiation could only warm the sea surfaces by a little more than 0.002 deg C since 1979. Yet, looking at the global sea surface temperature data, Figure 2, the surfaces of the global oceans warmed more than 0.3 deg C from 1979 to 2013, leaving about 93% 99.3% of the ocean surface warming unexplained.

Figure 2
A continuation of the Minnett-field-test argument is that manmade greenhouse gases and ocean mixing will cause the warming of the mixed layer of the oceans. The HockeySchtick counter could be applicable here as well. The mixed layer ranges in depth from about 20 to 200 meters. Unfortunately, temperature data specifically for the mixed layer are not available in an easy-to-use format, so let’s assume that the NODC’s vertically averaged temperature data for the depths of 0-100 meters captures the vast majority of the mixed layer. As shown in Figure 2, the warming rate of the top 100 meters of the ocean is slightly less than the surface. In other words, the warming rate based on the field tests presented by RealClimate can’t explain the vast majority of the warming of the top 100 meters.
Further to the RealClimate post by Peter Minnett, see the very recent ClimateConversation post HotWhopper wrong on ocean heat. It includes links to a three part discussion titled “Anthropogenic Ocean Warming?” by Richard Cummings, which covers the Minnett findings and other proposed mechanisms of anthropogenic warming of the oceans:
- Part 1: Skeptical Science Offside
- Part 2: The Improbable IPCC Mechanism
- Part 3: Rahmstorf, Schmittner and Nuccitelli
“AIR-SEA FLUXES ARE THE PRIMARY MECHANISM BY WHICH THE OCEANS ARE EXPECTED TO RESPOND TO EXTERNALLY FORCED ANTHROPOGENIC AND NATURAL VOLCANIC INFLUENCES”
The quote in the heading is from Chapter 10 (WG1) of the IPCC’s 5th Assessment Report.
Richard Cummings comments from Part 2 of his series begins:
That’s it. 25 years and five assessment reports after its 1988 formation, the IPCC has not been able to firm up an anthropogenic ocean heating and thermal sea level rise mechanism. The one they have come up with is only “expected”, indicating that they are unable to cite studies of the real-world phenomenon of non-solar air => sea energy fluxes actually occurring on a scale that would explain 20th century ocean heat accumulation in the order of 18×10^22 J and subjugate a solar-only mechanism.
“…HEAT PENETRATES THE OCEANS FASTER IN A WARMER CLIMATE”
The heading is a quote from the concluding remarks by Stefan Rahmstorf in the RealClimate post Sea-level rise: Where we stand at the start of 2013 (my boldface).
My bottom line: The rate of sea-level rise was very low in the centuries preceding the 20th, very likely well below 1 mm/yr in the longer run. In the 20th Century the rate increased, but not linearly due to the non-linear time evolution of global temperature. The diagnosis is complicated by spurious variability due to undersampling, but in all 20th C time series that attempt to properly area-average, the most recent rates of rise are the highest on record. At the end of the 20th and beginning of the 21st Century the rate had reached 3 mm/year, a rather reliable rate measured by satellites. This increase in the rate of sea-level rise is a logical consequence of global warming, since ice melts faster and heat penetrates faster into the oceans in a warmer climate.
Is this a very simplified rewording of the argument that, although the atmosphere is cooler than the ocean surfaces, greenhouse gases will reduce the rate at which oceans can release heat to the atmosphere?
See Richard Cummings response in Part 3 of his series.
MECHANISMS FOR THE WARMING OF THE OCEANS
Donald Rapp presented a simple model to explain how manmade greenhouse gases could warm the oceans in his guest post at Judith Curry’s blog ClimateEtc, back in May 2014. See his post Mechanisms for the Warming of the Oceans. That post drew more than 400 comments. If you’re going to cut and paste one of your or someone else’s comments from that thread, please leave a hyperlink to it.
INFRARED RADIATION FROM MANMADE GREENHOUSE GASES HAS INCREASED SINCE 1979, WHILE TOTAL SOLAR IRRADIANCE HAS DECREASED. THEREFORE, INFRARED RADIATION CAUSED THE OCEAN WARMING.
This is one of the favorite arguments for anthropogenic warming of the oceans: Infrared radiation has increased since 1979 but total solar irradiance at the top of the atmosphere has decreased. Therefore, according to that ill-conceived argument, the sun can’t explain the warming.
Why is it ill-conceived? We’re interested in the amount of sunlight reaching the ocean surfaces and entering into them, not the amount of sunlight reaching the top of the atmosphere.
There is evidence the amount of sunlight reaching Earth’s surface increased from 1979 to 2013. It comes from a specialized climate model called a reanalysis, and the reanalysis being discussed is the NCEP-DOE R-2. Unlike the climate models used to hindcast and predict global warming, a reanalysis uses data (sea surface temperature data, cloud cover data, aerosol data, total solar irradiance data, and the like) as inputs and calculates variables that aren’t measured directly. It’s a climate model, so we still have to look at it with a skeptical eye, but even so, the sunlight reaching the surface of the Earth increased from 1979 to 2013, according to the NCEP-DOE R-2 reanalysis. See Figure 3.

Figure 3
I’ve added a note to the graph:
Above what value do the oceans accumulate heat?
That was to counter another ill-conceived argument. Someone might look at the graph and see that sunlight at the surface peaked around the year 2002 and has since dropped, expecting the oceans to lose heat during the decline. But that argument would fail to consider many things, including the one noted.
This also brings to mind something written by Carl-Gustaf Rossby in 1959. It is part of the opening chapter of the book The Atmosphere and Sea in Motion edited by Bert Bolin. That chapter is titled “Current problems in meteorology”. In it, Rossby made two suggestions while discussing ocean processes (my boldface):
a) The assumption that our planet as a whole stands in firm radiation balance with outer space cannot be accepted without reservations, even if periods of several decades are taken into account.
b) Anomalies in heat probably can be stored and temporarily isolated in the sea and after periods of the order of a few decades to a few centuries again influence the heat and water-vapour exchange with the atmosphere.
So, assuming the NCEP-DOE R2 reanalysis is correct, how long would the recent increase in the amount of sunlight entering the oceans impact climate? According to Rossby, it could be decades or centuries.
Something else to consider: according to the NODC’s vertically averaged temperature data to depths of 2000 meters, the North Atlantic and the Pacific Ocean show little to no warming since 2005. The other two ocean basins, the South Atlantic and Indian Oceans are showing warming, but they only cover about 1/3 of the ocean surface. See Figure 4.

Figure 4
That lack of warming to depths of 2000 meters for two ocean basins that cover 2/3 of the ocean surface (North Atlantic and Pacific) is hard to reconcile in a world where greenhouse gases are said to be well mixed, meaning they’re pretty well evenly distributed around the globe.
THE OCEANS HAVE THEIR OWN GREENHOUSE-LIKE EFFECT
In his post, The Deep Blue Sea, John L. Daly presented something that must be considered in every discussion of ocean warming: the oceans have their own greenhouse like effect (I’ve added a hyperlink to John Daly’s Figure 1):
A greenhouse effect, by definition, means that the medium through which radiation passes is more transparent at visible wavelengths, but more opaque at infra-red wavelengths, thus letting in visible energy but obstructing the escape of sufficient infra-red energy to maintain thermal equilibrium without a rise in temperature.
The oceans also behave this way.
Reference to fig. 1 shows that the oceans let in visible solar radiation right down to 100 metres depth. However, the oceans cannot radiate from such depths, as infra-red radiation can only take place from the top few millimetres of ocean. Thus, the oceans are also behaving in a greenhouse-like manner, taking in heat and then trapping some of it to cause a temperature rise.
Phrased differently, sunlight can warm the oceans to depths of 100 meters, but the oceans can only release heat at the surface. Now consider that the oceans release heat primarily through evaporation (if memory serves, somewhere in the neighborhood of 90% of the heat loss from the oceans is through evaporation). UPDATE: Sorry, in this instance my memory was off. Of the approximately 180+ watts/m^2 downward shortwave radiation reaching the ocean surface, about half (about 100 watts/m^2) is released through evaporation.
THERE ARE NATURALLY OCCURRING PROCESSES THAT CAN CAUSE THE LONG-TERM WARMING OF THE OCEANS TO DEPTH
The naturally occurring processes that can warm the oceans, of course, are not considered in the climate models used by the IPCC. Climate modelers’ force the warming of the oceans based on their assumptions of how the infrared radiation from manmade greenhouse gases warm the oceans.
We’re going to break the oceans down into ocean-basin subsets, because, for two of the subsets, climate scientists addressed those portions of the oceans in the studies linked to this post.
I’ve presented these discussions in previous posts using ocean heat content data. For a change of pace, I’m presenting the NODC depth-averaged temperature data for the depths of 0-700 meters.
THE WARMING OF THE NORTH ATLANTIC TO DEPTH
As a preface to our first discussion, Figure 5 presents the depth-averaged temperature anomalies (0-700 meters) for the North Atlantic and for the rest of the global oceans. To determine the depth-averaged temperature anomalies for the rest of the global oceans, I area-weighted the North Atlantic data (11.5%, see the NOAA webpage here) and subtracted it from the global data. The units are deg C.

Figure 5
It very obvious that the North Atlantic to depths of 700 meters warmed at a much faster rate than the rest of the oceans, about 3.3 times faster from 1955 to present. That ocean basin only covers 11.5% of the surface of the global oceans, yet it represents about 35% of the ocean warming to depths of 700 meters.
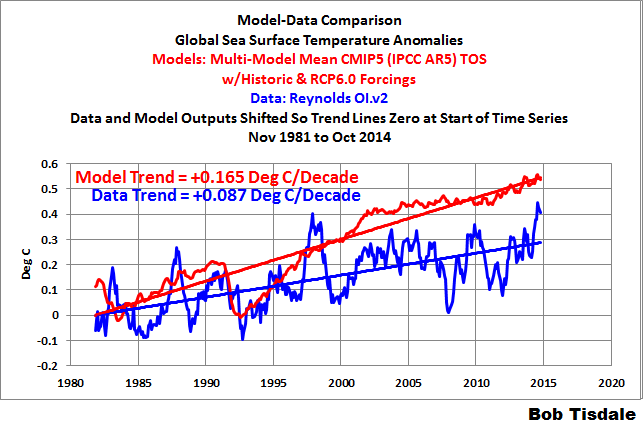
NOTE: It is unfortunate that the outputs of the climate model simulations of depth averaged temperature (or ocean heat content) are not available in an easy-to-use form so that the models can be compared to observations. We know climate models do not properly simulate the warming of ocean surfaces. They double the warming rate of the ocean surfaces over the past 33 years. See the model-data comparison graph here. Also see the posts here and here for additional discussions. It would be interesting to see how poorly the models simulate ocean warming to depth. [End note.]
Now consider what I wrote in that introductory portion from my upcoming book: It’s very obvious why the change in the ocean heat content is very important to the hypothesis of human-induced global warming. If the oceans could be shown to have warmed naturally, then the impacts of manmade greenhouse gases are much smaller than claimed by climate scientists.
And that’s exactly what a group of scientists did back in 2008. They determined the warming of the North Atlantic to 700 meters since 1955 was caused by naturally occurring processes, not by manmade greenhouse gases. We’ve discussed this paper a few times in recent years—in blog posts and in books. Here’s a portion of my ebook Who Turned on the Heat?
[START OF REPRINT FROM WHO TURNED ON THE HEAT?]
There is a study that provides an explanation for that additional warming. See Lozier et al (2008) The Spatial Pattern and Mechanisms of Heat-Content Change in the North Atlantic.
First, a quick introduction to one of the terms used in the following quotes: The North Atlantic Oscillation is an atmospheric climate phenomenon in the North Atlantic. Like the Southern Oscillation Index described in Chapter 4.3 ENSO Indices, the North Atlantic Oscillation is expressed as the sea level pressure difference between two points. The sea level pressures in Iceland, at the weather stations in Stykkisholmur or Reykjavik, can be used to calculate North Atlantic Oscillation Indices. Which Iceland location they elect to use as the high-latitude sea level pressure reference depends on the dataset supplier. The other point captures the sea level pressure at the mid-latitudes of the North Atlantic, and there are a number of locations that have been used for it: Lisbon, Portugal; Ponta Delgada, Azores; and Gibraltar. The North Atlantic Oscillation Index is primarily used for weather prediction. The direction and strength of the westerly winds in the North Atlantic are impacted by the sea level pressures in Iceland and the mid-latitudes of the North Atlantic, which, in turn, impact weather patterns in Europe and the East Coast of North America. If you live in those locations, you’ll often hear your weather person referring to the North Atlantic Oscillation. As will be discussed, winds in the North Atlantic can also impact Ocean Heat Content.
I’ll present two quotes from the Lozier et al (2008) paper. I’ll follow them with quotes from the press release that describes in layman terms how the North Atlantic Oscillation impacts the Ocean Heat Content of the North Atlantic. Back to Lozier et al (2008):
The abstract reads:
The total heat gained by the North Atlantic Ocean over the past 50 years is equivalent to a basinwide increase in the flux of heat across the ocean surface of 0.4 ± 0.05 watts per square meter. We show, however, that this basin has not warmed uniformly: Although the tropics and subtropics have warmed, the subpolar ocean has cooled. These regional differences require local surface heat flux changes (±4 watts per square meter) much larger than the basinwide average. Model investigations show that these regional differences can be explained by large-scale, decadal variability in wind and buoyancy forcing as measured by the North Atlantic Oscillation index. Whether the overall heat gain is due to anthropogenic warming is difficult to confirm because strong natural variability in this ocean basin is potentially masking such input at the present time.
In the paper, Lozier et al (2008) note, using NAO for North Atlantic Oscillation:
A comparison of the zonally integrated heat-content changes as a function of latitude (Fig. 4B) confirms that the NAO difference can largely account for the observed gyre specific heat-content changes over the past 50 years, although there are some notable differences in the latitudinal band from 35° to 45°N. Thus, we suggest that the large-scale, decadal changes in wind and buoyancy forcing associated with the NAO is primarily responsible for the ocean heat-content changes in the North Atlantic over the past 50 years.
Based on the wording of the two quotes, the paper appears to indicate that Lozier et al (2008) are describing the entire warming of ocean heat content in the North Atlantic. In other words, it seems that Lozier et al (2008) are not stating that the North Atlantic Oscillation is primarily responsible for the additional ocean heat-content changes in the North Atlantic, above and beyond the rest of the world, over the past 50 years; they’re saying it’s primarily responsible for all of the variability. The press release for the paper, on the other hand, leads you to believe the North Atlantic Oscillation is responsible for the North Atlantic warming above and beyond the global warming.
The Duke University press release for the paper is titled North Atlantic Warming Tied to Natural Variability. Though the other ocean basins weren’t studied by Lozier et al, the subtitle of the press release includes the obligatory reference to an assumed manmade warming in other basins: “But global warming may be at play elsewhere in the world’s oceans, scientists surmise”. To contradict that, we’ve found no evidence of an anthropogenic component in the warming of the other ocean basins.
The press release reads with respect to the North Atlantic Oscillation (NAO):
Winds that power the NAO are driven by atmospheric pressure differences between areas around Iceland and the Azores. “The winds have a tremendous impact on the underlying ocean,” said Susan Lozier, a professor of physical oceanography at Duke’s Nicholas School of the Environment and Earth Sciences who is the study’s first author.
Further to this, they write:
Her group’s analysis showed that water in the sub-polar ocean—roughly between 45 degrees North latitude and the Arctic Circle—became cooler as the water directly exchanged heat with the air above it.
By contrast, NAO-driven winds served to “pile up” sun-warmed waters in parts of the subtropical and tropical North Atlantic south of 45 degrees, Lozier said. That retained and distributed heat at the surface while pushing underlying cooler water further down.
The group’s computer model predicted warmer sea surfaces in the tropics and subtropics and colder readings within the sub-polar zone whenever the NAO is in an elevated state of activity. Such a high NAO has been the case during the years 1980 to 2000, the scientists reported.
“We suggest that the large-scale, decadal changes…associated with the NAO are primarily responsible for the ocean heat content changes in the North Atlantic over the past 50 years,” the authors concluded.
[END OF REPRINT FROM WHO TURNED ON THE HEAT?]
WHAT CAUSES THE WATER TO “PILE UP”, INCREASING OCEAN HEAT CONTENT?
Let’s discuss in more detail that “pile up” from the press release of Lozier et al. (2008). First, a few basics: The trade winds are a function of the temperature difference between the equator and higher latitudes. The warmer water near the equator causes warm air to rise there (convection). At the surface, winds blow from the mid latitudes toward the equator to make up for the deficit caused by the rising air, but the rotation of the Earth deflects that inrushing air to the west. Thus the trade winds blow from the northeast to the southwest in the Northern Hemisphere and from the southeast to the northwest in the Southern Hemisphere.
In the ocean basins, ocean circulation is driven primarily from the trade winds in the tropics blowing from east to west. That is, the trade winds push the surface waters from east to west in the tropics. Those westward-traveling waters warm under the tropical sun. They encounter a continental land mass and are directed toward the poles. In the North Atlantic, the poleward-flowing western boundary current is known as the Gulf Stream. It carries the warm tropical waters to the cooler high latitudes, where that water can release heat to the atmosphere more efficiently. At the mid-latitudes, those waters encounter the west to east winds known as westerlies and are blown eastward toward Europe and Africa. The eastern boundary current along Africa returns those cooler waters back toward the tropics, where they can be warmed again, completing the cycle. That ocean circulation loop is called a gyre.
Now for the “piling up”: Suppose the westerlies in the mid-latitudes slowed or reversed, while, at the same time, the trade winds were pushing the same amount of tropical water to the west and poleward. At mid-latitudes, the change in the strength or direction of the westerlies would resist the poleward transport of warm water from the tropics. That warm water would accumulate as a result. Here’s that quote from the press release again:
By contrast, NAO-driven winds served to “pile up” sun-warmed waters in parts of the subtropical and tropical North Atlantic south of 45 degrees, Lozier said. That retained and distributed heat at the surface while pushing underlying cooler water further down.
Presto. A naturally caused accumulation of heat in the North Atlantic.
Curiously, under the heading of “Beam Me Up, Scotty”, Stefan Rahmstorf of RealClimate presented a similar discussion in his post What ocean heating reveals about global warming. I, of course, commented on that in my post Comments on Stefan Rahmstorf’s Post at RealClimate “What ocean heating reveals about global warming”
Now suppose, at the same time, there were a series of strong El Niño events over a multidecadal period (1976 to the turn of the century for example), so that the tropical waters in the North Atlantic were naturally warmer than normal. Trenberth and Fasullo (2011) explain why some portions of the oceans remote to the tropical Pacific warm in response to an El Niño (my boldface):
But a major challenge is to be able to track the energy associated with such variations more thoroughly: Where did the heat for the 2009–2010 El Niño actually come from? Where did the heat suddenly disappear to during the La Niña? Past experience (Trenberth et al. 2002) suggests that global surface temperature rises at the end of and lagging El Niño, as heat comes out of the Pacific Ocean mainly in the form of moisture that is evaporated and which subsequently rains out, releasing the latent energy. Meanwhile, maximum warming of the Indian and Atlantic Oceans occurs about 5 months after the El Niño owing to sunny skies and lighter winds (less evaporative cooling), while the convective action is in the Pacific.
That additional sunlight during a period when El Niños dominated (1976 to the turn of the century) would add to the amount of accumulating warm water in the North Atlantic…and elsewhere.
And Trenberth now understands that the heat didn’t suddenly “disappear to during the La Niña”. It shows up as the “big jumps” in surface temperature in response to strong El Niño events. See the posts:
- Open Letter to the Royal Meteorological Society Regarding Dr. Trenberth’s Article “Has Global Warming Stalled?”
- The 2014/15 El Niño – Part 9 – Kevin Trenberth is Looking Forward to Another “Big Jump”
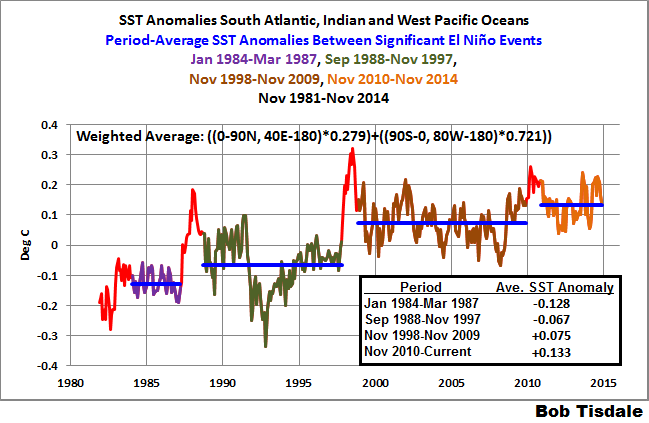
I also present those “big jumps” in the monthly sea surface temperature updates (November 2014 update is here). They stand out quite plainly in the sea surface temperature data for the South Atlantic, Indian and West Pacific Oceans. For a further discussion see the illustrated essay “The Manmade Global Warming Challenge” (42mb).
EXTRATROPICAL NORTH PACIFIC
The next paper to be discussed is Trenberth and Hurrell (1994): Decadal Atmosphere-Ocean Variations in the Pacific. In it, Trenberth and Hurrell were using an index derived from the sea level pressures of the extratropical North Pacific (30N-65N, 160E-140W), called the North Pacific Index, to explain shifts in the sea surface temperatures of the North Pacific. Again, a sea level pressure index reflects changes in the wind patterns. My Figure 6 is Figure 6 from Trenberth and Hurrell (1994).

Figure 6
That same shift appears in the depth-averaged temperature data for the extratropical North Pacific (24N-65N, 120E-80W) for the depths of 0-700 meters. But the shifts are delayed a year in the subsurface temperature data. See Figure 7.

Figure 7
I’ve color-coded 4 periods on the graph. The first period from 1955 to 1988 (dark blue) includes the downward shift in 1978. As a result of that shift in 1978 (that should be related to the shift in the sea level pressures and wind patterns), the depth-averaged temperature data shows a cooling trend from 1955 to 1988. That is, the extratropical North Pacific to depths of 700 meters cooled (not warmed) for more than 3 decades. The second period (red) captures the upward shift in 1988 and 1989 that, once again, should be related to the shift in the sea level pressures and wind patterns. From 1991 to 2002 (light blue), the extratropical North Pacific cooled once again to depths of 700 meters. And since the ARGO floats were deployed (black), the extratropical Pacific shows a slight warming to depth.
It’s blatantly obvious the extratropical North Pacific to depths of 700 meters would show no warming from 1955 to present if it wasn’t for that upward shift in 1988 and 1989. It’s also obvious that the downward shift in 1978 that extends to 1988 also impacts the long-term trend. That is, without the naturally caused downward shift in the late-1970s the long-term warming rate would be less. Obviously, natural variability, not manmade greenhouse gases, dominates the variability and long-term warming of the extratropical Pacific to the depths of 700 meters.
TROPICAL PACIFIC
We isolate the vertically averaged temperature data to depths of 700 meters for the tropical Pacific because the tropical Pacific is where El Niño and La Niña events take place, and El Niño and La Niña events, collectively, are the dominant forms of natural variability on Earth. A further clarification: while El Niño and La Niña events are focused on the equatorial Pacific, they directly impact the entire tropical Pacific. See the animation here for an extreme example of the effects of an El Niño on the sea level residuals of the tropical Pacific.
Let’s start with two quotes from (again) Kevin Trenberth. According to Trenberth, El Niño events are fueled by sunlight, not manmade greenhouse gases. In the much-cited Trenberth et al. (2002) The evolution of ENSO and global atmospheric surface temperatures, they stated (my boldface and brackets):
The negative feedback between SST and surface fluxes can be interpreted as showing the importance of the discharge of heat during El Niño events and of the recharge of heat during La Niña events. Relatively clear skies in the central and eastern tropical Pacific [during a La Niña] allow solar radiation to enter the ocean, apparently offsetting the below normal SSTs, but the heat is carried away by Ekman drift, ocean currents, and adjustments through ocean Rossby and Kelvin waves, and the heat is stored in the western Pacific tropics. This is not simply a rearrangement of the ocean heat, but also a restoration of heat in the ocean. Similarly, during El Niño the loss of heat into the atmosphere, especially through evaporation, is a discharge of the heat content, and both contribute to the life cycle of ENSO.
NOTE: That’s the source of my standard description of ENSO as a chaotic, naturally occurring, sunlight-fueled, recharge-discharge oscillator…with El Niños acting as the discharge phase and La Niñas acting as the recharge phase. But La Niñas also help to redistribute the leftover warm waters from the El Niños. [End note.]
Also see Trenberth and Fasullo (2011). They confirm that ENSO is sunlight-fueled during La Niña events:
Typically prior to an El Niño, in La Niña conditions, the cold sea waters in the central and eastern tropical Pacific create high atmospheric pressure and clear skies, with plentiful sunshine heating the ocean waters. The ocean currents redistribute the ocean heat which builds up in the tropical western Pacific Warm Pool until an El Niño provides relief (Trenberth et al. 2002).
Figure 8 presents the vertically averaged temperature anomalies (0-700 meters) for the tropical Pacific. El Niño and La Niña events directly impact the top 300 meters, so this depth captures their direct impacts. I’ve highlighted in maroon the three 3-year La Niña events of 1954 to 1957, 1973 to 1976, and 1998 to 2001. After those 3-year La Niña events, the tropical Pacific shows cooling, not warming. That indicates that the shorter La Niñas that follow El Niños only recharge part of the warm water released from the tropical Pacific by the El Niños. Also, I’ve highlighted in red the 7-month period associated with the 1995/96 La Niña. (See the old version of the NOAA ONI index.) The 1995/96 La Niña created the warm water that fueled the 1997/98 El Niño, which is responsible for the sharp drop in temperature following the heat uptake of the 1995/96 La Niña. The “overcharge” from the 1995/96 La Niña and the recharge during the 1998-01 La Niña obviously caused an upward shift in the subsurface temperatures of the tropical Pacific.
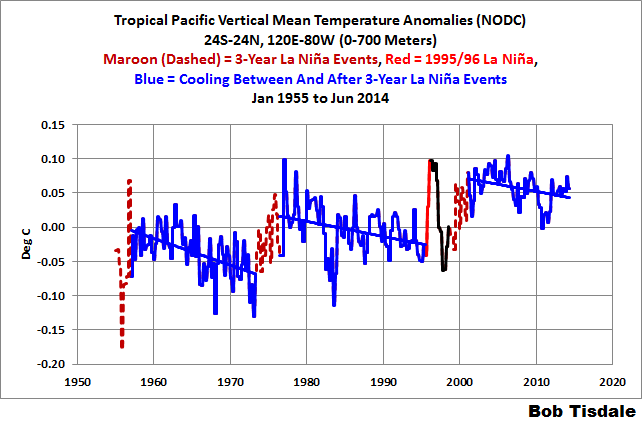
Figure 8
What is also blatantly obvious is the warming of the tropical Pacific to depth is dependent on 4 La Niña events. And according to Trenberth et al. (2002) and Trenberth and Fasullo (2011), sunlight warms the tropical Pacific during La Niñas, not infrared radiation from manmade greenhouse gases. (In the real world, downwelling longwave radiation decreases during La Niña events.)
BOTTOM LINE ON OCEAN TEMPERATURE DATA FOR THE DEPTHS OF 0-700 METERS
Subsurface temperature data (and ocean heat content data) for the North Atlantic, the Extratropical North Pacific and the Tropical Pacific all indicate that naturally occurring coupled ocean-atmosphere processes are the primary causes of ocean warming to depth, not manmade greenhouse gases. In fact, the data for the tropical Pacific and extratropical North Pacific show those oceans can cool for decadal and multidecadal periods between short-term naturally caused warming episodes. Those decadal and multidecadal cooling periods further suggest that manmade greenhouse gases have no measureable impact on ocean warming to depth.
NOTE: Someone is bound to note that I’ve only presented subsurface ocean temperature data for the top 700 meters and only for the oceans of the Northern Hemisphere and the tropical Pacific. If I receive a comment to that effect on the thread, I will refer that blogger to the 2 posts linked in the introduction. Here they are again:
- Is Ocean Heat Content Data All It’s Stacked Up to Be?
- AMAZING: The IPCC May Have Provided Realistic Presentations of Ocean Heat Content Source Data
CLOSING
I’m sure I’ve missed a few arguments for and against the anthropogenic ocean warming. If you introduce others, please provide links where possible.
UPDATE 2: While preparing this post, I overlooked an excellent post by Willis Eschenbach Radiating The Ocean.


Thorough, clear, and yet detailed — another excellent post. So a question: is there any plausible mechanism by which GHGs could be a major factor in regulating cloud cover to increase the amount of short wave radiation reaching the ocean?
Gary, I’ve never seen any arguments to that effect. In fact, the models show a long-term decrease in downward shortwave radiation reaching the surface of the oceans (past and future):

Thanks, Bob. An excellent post, lots to learn.

The NAO index can be seen at the KNMI:
Bob,
Please consider this. It’s quite fundamental to the whole premise behind this blog post.
A reply of mine to Willis Eschenbach on the equivalent WUWT thread. The Willis comment is here: http://wattsupwiththat.com/2014/12/09/arguments-for-and-against-human-induced-ocean-warming/#comment-1810507
My reply:
“Willis,
You’re absolutely right! For all the people who believe that there is an actual, separate, thermodynamically working flux/transfer of radiative energy from the atmosphere down to the surface (more than twice as intense as the solar heat flux), your four arguments should be unassailable.
You’re right. In this case, there is no other way for the surface to get from 232K (-41C) (highest possible BB emission temp for a surface absorbing a radiative flux of 165 W/m^2, like the solar one) to 289K (+16C), the actual, measured (averaged) global surface temp, than to absorb an additional radiative flux of 345 W/m^2 coming in from the atmosphere:
(Derived from Stephens et al. 2012.)
Pure solar radiative equilibrium: 165 W/m^2 IN, 165 W/m^2 OUT; temp 232K.
With radiatively active atmosphere added: 165 W/m^2 + 345 W/m^2 = 510 W/m^2 IN, 398 W/m^2 + 112 W/m^2 (combined conductive/evaporative loss) OUT; temp 289K.
An increase of [289-232=] 57K strictly as a result of the additional 345 W/m^2 IN (minus the non-radiative 112 W/m^2 OUT) giving an equilibrated radiative output of 398 W/m^2.
Problem is, a spontaneous transfer of energy from a cooler thermodynamic system to a warmer thermodynamic system, where this transfer of energy ALONE* raises the absolute temperature of the warmer system (in this specific case, from 232 to 289K), constitutes a direct violation of the 2nd Law of Thermodynamics. It can’t and won’t happen in nature.
*It gets no help from the original incoming solar heat flux. It stays at 165 W/m^2. It gets no help from the outgoing radiative flux (your UWLWIR). It is never in any way reduced during warming. It increases during warming, forced to grow for each (re)cycle up to steady state. Thus, the warming is ONLY and wholly accomplished by the absorption of the additional incoming flux from the atmosphere, as if this were directly equivalent to the solar heat flux.
If your explanation of some real-world effect ends up directly violating the 2nd Law of Thermodynamics, you KNOW that there’s something wrong with your explanation. Simple as that. Back to the drawing board.
I’ll leave it to you (and the rest of the people here on this thread) to ponder exactly where and how the “extra surface warming by back radiation” explanation fails …”
– – –
Bob, the rGHE/AGW idea of a separate radiative flux/transfer of energy from the cooler atmosphere down, capable of doing *anything* of thermodynamic worth (this includes direct heating and provoking evaporative cooling) to the warmer surface, is a mere delusion. It cannot happen.
When people claim they ‘measure’ it, they don’t. They calculate it, based on the a priori assumption that it exists. They ‘see’ it only because they start out with the premise that they should see it and therefore program their instruments to compute it from other (actual, physical) phenomena detected (like ‘heat flux’ and ‘temperature’), and from this to present it as ‘real’. It’s all completely circular.
Also,
It should be a pretty obvious fact, almost to the point of being intuitive, that a body of water absorbing a first round of a solar SW flux, and being heated to depth by it, will not be able to also shed this particular amount of energy within a similar period of time by radiating (LWIR) back out from its surface. At any time. Why? The energy coming in as SW is absorbed across the three dimensions of the volume of water, but the energy going back out as LW is only emitted from the two-dimensional surface.
This first round of SW energy is after all not instantly able to warm the body of water up to the point where its surface temperature correlates to a LW emission flux equal to the originally absorbed SW flux.
In a purely radiative setting, this would pose no problem. The system would simply move towards a steady state, by incoming (SW) energy gradually accumulating in the volume (by more always coming IN than going OUT, rising fast at first, then progressively slower) until the point where such a surface temperature did result. At this point, the incoming and outgoing radiative fluxes would match and there would be no more warming.
On our planet, however, there’s an atmosphere on top of the solar-heated body of water, and the ocean releases most of its absorbed energy back out into this atmosphere by way of evaporation.
This means that on real Earth, the water surface will reach its steady state temperature long before radiative balance has been accomplished, i.e. as much energy is released from the surface as taken up by the volume of water per unit of time even at much lower temperatures than the ideal Stefan-Boltzmann blackbody situation would seem to demand. Courtesy of the release of latent heat through evaporation.
– – –
This highly asymmetrical relationship between incoming and outgoing to the ocean is also reflected in the responsiveness to changes in surrounding conditions.
This is where for instance Peter Minnett falls through in his interpretation of his results from the tropical Pacific in 2004-6.
It has long been a well-known fact that clouds and cloud cover have a net cooling effect on the surface beneath, in the tropics as well as globally. The global ‘net cloud radiative effect’ (according to CERES) is -21 W/m^2:
The effect of blocking the incoming solar from being absorbed at or below the surface (slowing down surface warming) turns out to be much stronger than the opposite one, the effect of slowing down surface cooling. Minnett clearly knew this as well. And still he chose to ignore it, thus failing to incorporate it into his analysis. What he observed were short-term (transient) energy transfer responses to change at the air/sea interface, not to the overall energy balance.
The crucial point is this: The surface responds directly and nearly instantly to the changes – cooling is slowed as clouds cover the sky (this involves all the energy transfers, not just the radiative one); the bulk of the water, though, is much more sluggish in its response. The solar input is diminished with increased cloud cover, but this doesn’t show up as a decrease in surface temperature until the change has propagated through the whole volume of water influenced by it.
Cooling happens directly at the air/sea interface. Warming, on the other hand, occurs throughout the volume of water, and so a change in input will need more time to move towards a new steady state.
Minnett’s cloud (not CO2!) results would thus naturally have been inverted if he only let them settle into a new steady state rather than focus solely on the initial and transient responses at the very surface …
This invalidates his findings completely. Clouds don’t lead to overall surface warming.
Thanks, Kristian.
Hi Bob, great post, something I don’t quite understand is where the extra heat is coming from for these climate shifts? From you earlier posts I had thought El Nino doesn’t add any heat to the ocean-atmosphere system but simply moves it around?
Hi Dusty. For almost 6 years, I’ve been illustrating and discussinghow that ENSO contributes to long-term warming. Here’s a detailed introduction to ENSO processes:
And here’s one of the discussions of how ENSO interacts with cloud cover so that sunlight provides the fuel for El Nino events:
Cheers.
thnx for your posts. i am learning everyday .
Pingback: Deep Ocean Geothermal Heat and OHC | Thongchai Thailand