
INITIAL NOTE: If you have not had the opportunity to view a model-data comparison of global surface temperature anomalies, where the models and data are compared during the two warming periods and two cooling (or warming-slowdown) periods since 1880, please take the time to run through this post. It presents model-data comparisons of global sea surface temperature anomalies using time-series and zonal-mean graphs, and trend maps. It is a long post—about 3300 words with 20 illustrations—but the models perform so poorly you’ll wonder how the IPCC has gotten away with claiming climate models can be used to attribute global warming to manmade greenhouse gases. (This initial note does not appear in the pdf version of the post, which is linked at the end.)
PREFACE
The IPCC saved the most misleading graph in their approved final version of the AR5 Summary for Policymakers for last. It’s their Figure SPM.10, included here as my Figure 1. It presents global surface temperature anomalies as a function of cumulative manmade carbon dioxide emissions.

Figure 1
The accompanying text begins:
Global mean surface temperature increase as a function of cumulative total global CO2 emissions from various lines of evidence. Multi-model results from a hierarchy of climate-carbon cycle models…
That’s as far as anyone needs to read. The illustration is based on climate models.
Climate models are so far removed from reality that they cannot be used to attribute global warming to natural processes or to human-induced factors and cannot be used for predictions of future climate based on projections of manmade greenhouse gases.
Climate scientists/modelers have only proven they are capable of creating complex numerical models and that they are able to tune those models to roughly approximate the rate of warming during the last warming period that started in the mid-1970s and ended about the turn of the century, but only during that period. Further, even the rates of numerical warming created within the models during that last warming period are flawed.
NOTE: Much of this post is background information. It shows how poorly the climate models simulated global sea surface temperatures since 1880. If you’re not interested in how, where and why climate models are not capable of simulating the surface temperatures for about 70% of the planet, then please scroll forward to the heading of CLIMATE MODELS DO NOT SUPPORT THE HYPOTHESIS OF HUMAN-INDUCED GLOBAL WARMING after Figure 15.
INTRODUCTION
We compared data and climate model outputs of global surface temperatures (land and ocean) since 1880 in the post Model-Data Comparison with Trend Maps: CMIP5 (IPCC AR5) Models vs New GISS Land-Ocean Temperature Index. For my book Climate Models Fail, I revised the breakpoints in the comparisons to 1914, 1945 and 1975 (instead of 1917, 1944 and 1976). The breakpoints of 1914 and 1945 were determined by Dr. Leif Svalgaard. See his April 20, 2013 at 2:20 pm and April 20, 2013 at 4:21 pm comments on the WattsUpWithThat cross post. And for 1975, I referred to statistician Tamino. Using those breakpoints will hopefully avoid the claims of cherry-picking.
In this post, we’ll be looking at global sea surface temperature anomalies starting in 1880 and ending in year-to-date (YTD) 2013. The dataset is ERSST.v3b—which is used by GISS in their Land-Ocean Temperature Index—for consistency with the previous post and with Climate Models Fail. The models are the multi-model ensemble mean of the simulations of sea surface temperatures for the CMIP5 (IPCC AR5) models, using the historic and RCP6.0 scenarios. (See the post On the Use of the Multi-Model Mean.) We’ll break the data and models down into the two warming periods and two cooling/reduced warming periods using the same breakpoints of 1914, 1945 and 1975. Because global land-plus-sea surface temperature data and sea surface temperature data don’t have the same breakpoints, 1914, 1945 and 1975 will look at little odd. Refer to Figure 2.
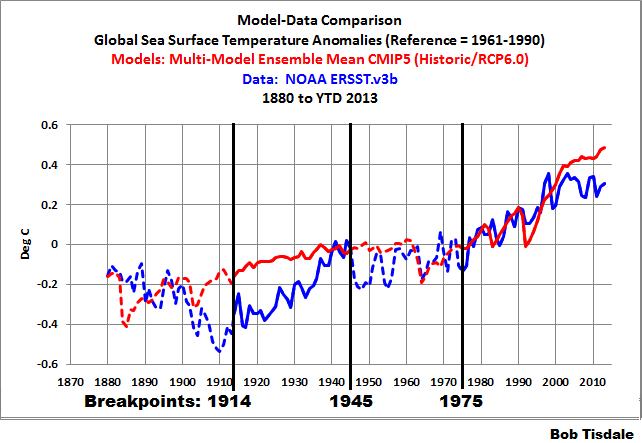
Figure 2
Yes, the models perform that poorly.
It’s pretty remarkable that climate modelers have been trying for a couple of decades to reproduce the global surface temperature record and babbling on and on about CO2 driving global surface temperature warming—when, bottom line, climate models cannot simulate surface temperatures for 70% of the surface of the globe since 1880. The only reason the modelers even come close during the recent warm period is because the modelers tune the models to that period. (See Mauritsen, et al. “Tuning the Climate of a Global Model” [paywalled]. (Preprint edition is here.))
The linear trends are as calculated by EXCEL.
For the discussion of each period, the models are compared to observations-based data using:
- time-series graphs,
- trend maps that show warming and cooling rates in deg C/year, and
- trends on a zonal-mean (latitude average) basis. (For those new to the zonal-mean graphs, I provide an overview in the first discussion.)
Let’s start with the period when models performed best, and then work out way back in time.
RECENT WARMING PERIOD (1975 to YTD 2013)
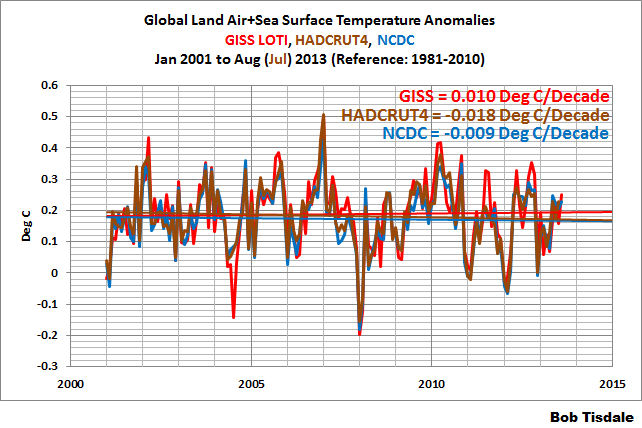
Global (land+sea) surface temperatures stopped warming in 2001. (See the post here.) Even so, the models show the warming continuing to present times. So we’ll use (year-to-date) 2013 as the end year for the recent warming period.
As shown in Figure 3, the modeled warming rate of global sea surface temperatures is about 40% higher than the observed trend during the period of 1975 to (YTD) 2013. Keep in mind the models had been tuned to the observed surface temperatures during much of this period.

Figure 3
Not only do the models overestimate the overall warming during this period, they fail to capture where sea surface temperatures warmed (and cooled) and the extent of that warming (or cooling). (See Figure 4.)

Figure 4
The patterns in time and the spatial patterns of sea surface temperature warming (or cooling) contribute to when and where land surface temperatures vary. Therefore, based on the models’ failures to simulate sea surface temperatures properly, it is unlikely that they can properly simulate land surface air temperature anomalies.
The climate models used by the IPCC in their 5th Assessment Report failed to capture:
- the extra warming of the North Atlantic caused by the Atlantic Multidecadal Oscillation. (See Ruiz-Barradas et al. (2013)) This helps to explain why models cannot simulate the rate of polar amplification in the Northern Hemisphere and why they cannot simulate the rate of Arctic sea ice loss (See Stroeve, et al. (2012) “Trends in Arctic sea ice extent from CMIP5, CMIP3 and Observations” [paywalled]),
- the cooling in the Southern Ocean, which explains why climate models cannot simulate sea ice area in the oceans surrounding Antarctica,
- the pattern of warming and cooling in the Pacific. This is caused by the model failures to properly simulate the coupled ocean-atmosphere processes associated with El Niño and La Niña events. (See Guilyardi et al. (2009) and Bellenger, et al. (2013))
Note: For further information about the Atlantic Multidecadal Oscillation, see NOAA’s AOML (Atlantic Oceanographic and Meteorological Laboratory) Frequently Asked Questions webpage here, and my blog post here and my introduction to the Atlantic Multidecadal Oscillation here.
In Figure 5, the warming and cooling rates are shown on a zonal mean basis. The variable for the zonal mean graphs in this post are the trends in deg C/decade and it is shown in the (vertical) y-axis. The (horizontal) x-axis is latitude, so the South Pole is (at -90) on the left, the North Pole is (at 90) on the right, and the equator is at zero deg latitude. Basically, the zonal mean graphs in this post present the warming (and cooling) rates of sea surface temperatures at the different latitudes.

Figure 5
As shown in Figure 5, for the period of 1975 to (YTD) 2013, the models:
- overestimated the warming of tropical sea surface temperatures by about 50%,
- underestimated the warming in the mid-latitudes of the Northern Hemisphere, and
- show no similarity to the warming and cooling rates in the surface temperatures of the Southern Hemisphere oceans south of about 35S.
That poor performance makes one wonder how the modelers could ever hope to attempt to simulate land surface air temperatures.
Figures 3, 4 and 5 showed how poorly the latest generation of climate models (CMIP5) simulated the warming (and cooling) of global sea surface temperatures during the recent warming period of 1975 to (YTD) 2013 — a period to which they are “tuned”. The models are not going to show improvement as we look at the earlier periods.
MID-20th CENTURY REDUCED-WARMING PERIOD (1945 to 1975)
According to the ERSST.v3b data, Figure 6, sea surface temperatures warmed at a reduced rate from 1945 to 1975. (Also see the discussion of HADSST3 data following Figure 8.) The models estimated cooling during this period, basically a response to the eruption of Mount Agung in 1963-64.

Figure 6
The differences are even more obvious when we look at the maps of warming and cooling trends during this period. (See Figure 7.)

Figure 7
For the period of 1945 to 1975, the climate models used by the IPCC for their 5th Assessment Report failed to simulate:
- the cooling of sea surface temperatures in the North Atlantic associated with the Atlantic Multidecadal Oscillation, and
- the warming of sea surface temperatures in the entire Southern Hemisphere.
This is further illustrated by the warming and cooling rates when the data and model outputs are presented on a zonal mean basis, Figure 8.

Figure 8
NOTE: The UKMO (UK Met Office) revised their sea surface temperature dataset in response to the findings of Thompson et al (2009) Identifying signatures of natural climate variability in time series of global-mean surface temperature: Methodology and Insights. (See Kennedy et al. (2013) Part 1 and Part 2.)
The greatest changes to the HADSST data occurred from the 1940s to the 1960s. The adjusted UKMO HADSST3 sea surface temperature data now shows cooling during the period of 1945 to 1975 — a cooling that is magically in line with the models. (See Figure 9.)

Figure 9
EARLY 20th CENTURY WARMING PERIOD (1914 to 1945)
The most obvious model failing occurs during the early 20th Century warming period of 1914-1945. It stood out like a sore thumb in Figure 2, and it looks no better in Figure 10. Global sea surface temperature anomalies warmed at a rate of 0.125 deg C/decade, but the models indicated that they should only have warmed at a rate of 0.036 deg C/decade IF sea surfaces were warmed by manmade greenhouse gases, including carbon dioxide. The observed warming was about 3.5 times greater than the modeled warming. That additional observed warming, therefore, has to result from natural variability — it can’t be explained by the assumed impacts of anthropogenic warming shown by the models. And that’s a gigantic problem for hypothesis of human-induced global warming, which we’ll discuss later in this post.

Figure 10
Looking at the trend maps, Figure 11, there’s no reason to go into any great detail about where the models failed. They failed to capture the warming just about everywhere. How pathetic is that!

Figure 11
And as shown in Figure 12, the failings are further confirmed by the trends on zonal mean (latitude average) basis.

Figure 12
EARLY COOLING PERIOD (1880 to 1914)
The models used by the IPCC for their 5th Assessment Report indicate global sea surface temperatures should have warmed at a rate of about 0.03 deg C per decade from 1880 to 1914, Figure 13, but according to NOAA’s ERSST.v3b data (used by GISS for their Land-Ocean Temperature Index) sea surface temperatures cooled at a strong rate of more than -0.1 deg C/decade. The models missed their mark by about 0.13 deg C/decade during this early cooling period.

Figure 13
The trend maps in Figure 14 and the modeled and observed trends on a zonal mean basis, Figure 15, show how poorly the models simulated sea surface temperatures during this period.

Figure 14
###

Figure 15
CLIMATE MODELS DO NOT SUPPORT THE HYPOTHESIS OF HUMAN-INDUCED GLOBAL WARMING
Much of the post to this point was background information for this portion.
Recall that in Figure 1, the IPCC presented their climate model-based assumptions that (1) global surface temperatures warmed in response to accumulated manmade carbon dioxide emissions from 1850 to present and (2) that global surface temperatures would continue to warm into the future based on climate model projections.
The virtual sea surface temperatures in climate models are forced to warm primarily by the assumed impacts of well-mixed anthropogenic greenhouse gases, with carbon dioxide the dominant manmade greenhouse gas. (See Figure 16) For example, according to the forcings used by GISS in their climate models, the climate forcings associated with well-mixed greenhouse gases increased at a rate that was about 3.8 times faster during the later warming period of 1975 to 2011 than during the early warming period of 1914 to 1945.

Figure 16
Climate modelers then suppress the hypothetical warming in the climate models with other manufactured climate forcing datasets. (See Figure 17) Using the GISS forcings again, however, we can see that the Net Forcings still show the higher rate of increase during the later warming period, and that it’s still about 3.8 times faster during the later warming period of 1975-2011 than during the early warming period.

Figure 17
Then, based on all the gazillions of programming assumptions made by the climate modelers, the climate models run through their programmed routines and regurgitate virtual number-crunched sea surface temperatures. (See Figure 18) By no strange coincidence, the modeled sea surface temperatures warmed at a rate during the later warming period that was about 3.9 times faster than during the early warming period of 1914 to 1945. (Note that there are 2 more years of model outputs for the later warming period in Figure 18 than for the forcing graphs in Figures 16 and 17. GISS has not updated their forcings through 2013.)

Figure 18
Bottom line for the models: according the forcings used as inputs and according to the multi-model ensemble member mean output of the latest and greatest (CMIP5) generation of climate models, global sea surface temperatures during the later warming period (1975 to YTD 2013) should have warmed almost 4 times faster than they did during the early warming period (1914 to 1945).

Figure 19
But, unfortunately for the models, Figure 19, the actual observed warming rate during the later warming period was less than during the early warming period. That is, the sea surface temperatures warmed about 25% faster during the early warming period than during the late warming period.
Granted, during the last 12 years of the late warming period, global sea surface temperatures have not warmed. We could eliminate the data for the current hiatus period (2002 to 2013 for example) and show the warming during the abridged late warming period (1975 to 2001) was comparable to the trend during the early period. But, that still doesn’t help the models.
Note: The following is the Summary of Chapter 4.4 from Climate Models Fail. Though Chapter 4.4 presented the combined global (land+ocean) surface temperatures, the conclusion of that chapter also applies to this post.
The fact that the models simulated the warming better during the more recent warming period does not mean that manmade greenhouse gases caused that warming — it simply reveals that the modelers managed to tune their models to perform better for the more recent warming period.
The climate models cannot simulate the observed rate of warming during the early warming period (1914-1945), which warmed at about the same rate as the recent warming period (1975-2012). This illustrates that global surface temperatures can warm without being forced — unlike climate models which must be driven by the natural and anthropogenic forcings used as inputs. And the similarities between the observed warming rates during the early and late warming periods indicate that the much higher anthropogenic forcings during the late warming period had little impact on the rate at which observed temperatures warmed.
In other words, the climate models and data do not support the hypothesis of anthropogenic forcing-driven global warming; they contradict it.
The world portrayed by all those number-crunching climate models is a fantasy world — with little or no relationship to the real world.
LET’S ADD INSULT TO INJURY
For more than 4 years, I have presented how, once ocean heat content data and satellite-era sea surface temperature data are broken down into logical subsets, they no longer support the hypothesis of human-induced global warming. That is, the NODC’s ocean heat content data for the depths of 0-700 meters and NOAA’s satellite-enhanced (Reynolds OI.v2) sea surface temperature data indicate that the oceans warmed in response to naturally occurring, sunlight-fueled, coupled ocean-atmosphere processes—not via manmade greenhouse gases. If this subject is new to you, refer to my illustrated essay “The Global Warming Challenge” (42MB pdf).
The natural warming of the global oceans was also the subject of two YouTube videos — for those who would like to listen and watch me explain how that happens. I prepared those well-illustrated videos for the WUWT-TV special last year. Part 1 is here and Part 2 is here.
I referred to my latest book Climate Models Fail a number of times in this post. Climate models Fail is a collection of model-data comparisons, and it includes a chapter about research papers that are very critical of climate model performance. In addition, I also present the natural warming of the oceans in Section 9. See the Table of Contents in the Free Preview to Climate Models Fail. About 60 pages of the 350-page pdf edition, including 40 illustrations, pertain to this topic. (Climate Models Fail is also available in Kindle format, through Amazon.) While the subject matter (natural warming of the global oceans) is the same as past presentations, in Climate Models Fail, I presented the discussion in a different order, which will hopefully make it easier to understand. Climate Models Fail was also edited by someone without a technical background so it is definitely easier to read.
And of course there is much more detail in my book Who Turned on the Heat? — The Unsuspected Global Warming Culprit: El Niño-Southern Oscillation.
MODEL-DATA DIFFERENCE
Figure 20 illustrates the observed annual global sea surface temperature anomalies from 1880 to (YTD) 2013. Also shown is the difference between the modeled and observed global sea surface temperature anomalies, with the data subtracted from the mean of the model outputs. I’ve changed the base years for anomalies to the full period of the data (1880 to 2012) so that the base years did not influence the difference.

Figure 20
Somehow, the climate science community, under the direction of the IPCC, would like the public and policymakers to believe that their climate models are realistic representations of climate.
CLOSING
Global sea surface temperatures warmed faster during the early 20th Century warming period of 1914 to 1945 than during the recent warming period of 1975 to (YTD) 2013. On the other hand, the climate models used by the IPCC for their 5th Assessment Report indicate something else entirely. The models indicate sea surface temperatures should have warmed almost 4 times faster from 1975 to present than they did from 1914 to 1945. Clearly, the climate models used by the IPCC cannot be employed to attribute global warming to manmade greenhouse gases like carbon dioxide, and they definitely cannot be used to forecast climate over any time period based on projections of future manmade greenhouse gas emissions.
Yet, the climate scientists who prepared the 5th Assessment Report for the IPCC create illustrations like their SPM.10 (my Figure 1), which amusingly use climate models as “proof” that past global warming was caused by carbon dioxide emissions and that global temperatures will continue to warm in response to future CO2 emissions. The climate scientists’ unwavering belief that carbon dioxide drives global warming, despite the climate models clearly showing otherwise, is evidence of their delusions about CO2 or their need to misrepresent their models (for any number of reasons). Personally, I think it’s a combination of the two.
SOURCE
The model outputs and data, including the trend maps, are available through the KNMI Climate Explorer.
SUPPLEMENT TO CLIMATE MODELS FAIL
This post is available here in pdf format for those readers who would like to file it as a supplement to Climate Models Fail.


Hi Bob
Thanks again for an interesting post. The SPM said:
“The long-term climate model simulations show a trend in global-mean surface temperature
from 1951 to 2012 that agrees with the observed trend (very high confidence). There are,
however, differences between simulated and observed trends over periods as short as 10 to 15
years (e.g., 1998 to 2012). {9.4, Box 9.2}”
It might be useful to show the 1951-2012 period as well, including trend maps and zonal means etc.
Marcel
Pingback: IPCC Misrepresents the Instrument Temperature Record | Bob Tisdale – Climate Observations
Marcel Crok: I’ll take a look, but I’ve clearly shown in this post that there are major errors over multidecadal time spans, not simply 15 years.
Regards
Marcel, I need to get into this a little more and try to figure out why they’re focusing on the period of 1951-2012, other than the obvious reason that the models are worthless before then. (They aren’t much better afterward.)
Regards
Pingback: Will their Failure to Properly Simulate Multidecadal Variations In Surface Temperatures Be the Downfall of the IPCC? | Bob Tisdale – Climate Observations
Pingback: Will their Failure to Properly Simulate Multidecadal Variations In Surface Temperatures Be the Downfall of the IPCC? | Watts Up With That?
Pingback: Tamino Resorts to Childish Attempts at Humor But Offers Nothing of Value | Bob Tisdale – Climate Observations
Pingback: Tamino Resorts to Childish Attempts at Humor But Offers Nothing of Value | Watts Up With That?
Pingback: IPCC Adjusts Model-Predicted Near-Term Warming Downwards | Bob Tisdale – Climate Observations
Pingback: IPCC Adjusts Model-Predicted Near-Term Warming Downwards | Watts Up With That?
Pingback: Open Letter to Lewis Black and George Clooney | Bob Tisdale – Climate Observations
Pingback: Open Letter to Lewis Black and George Clooney | Watts Up With That?
Pingback: Trenberth and Fasullo Try to Keep the Fantasy Alive | Bob Tisdale – Climate Observations
Pingback: Trenberth and Fasullo Try to Keep the Fantasy Alive | Watts Up With That?
Pingback: Questions Policymakers Should Be Asking Climate Scientists Who Receive Government Funding | Bob Tisdale – Climate Observations
Pingback: Questions Policymakers Should Be Asking Climate Scientists Who Receive Government Funding | Watts Up With That?
Pingback: Open Letter to Jon Stewart – The Daily Show | Bob Tisdale – Climate Observations
Pingback: Open Letter to Jon Stewart – The Daily Show | Watts Up With That?
Pingback: Quick Comments on England et al. (2014) | Bob Tisdale – Climate Observations
Pingback: An Odd Mix of Reality and Misinformation from the Climate Science Community on England et al. (2014) | Bob Tisdale – Climate Observations
Pingback: An Odd Mix of Reality and Misinformation from the Climate Science Community on England et al. (2014) | Watts Up With That?
Pingback: On Chylek et al (2014) – The Atlantic Multidecadal Oscillation as a Dominant Factor of Oceanic Influence on Climate | Bob Tisdale – Climate Observations
Pingback: On Chylek et al (2014) – The Atlantic Multidecadal Oscillation as a Dominant Factor of Oceanic Influence on Climate | Watts Up With That?
Bob: Do you or did you have relatives in or from Dunkirk, New York. I’m originally from Dunkirk and peddled papers with a Bob Tisdale in Dunkirk from 1939 – 1942, after which I went off to war & haven’t been back there very much since then.
Gene
Pingback: The 2014/15 El Niño – Part 5 – The Relationship Between the PDO and ENSO | Bob Tisdale – Climate Observations
Pingback: The 2014/15 El Niño – Part 5 – The Relationship Between the PDO and ENSO | Watts Up With That?
Pingback: There is a Wide Range in the ARGO-Era Warming (and Cooling) Rates of the Oceans to Depths of 2000 Meters | Bob Tisdale – Climate Observations
Pingback: With ARGO, There is a Wide Range Warming (and Cooling) Rates of the Oceans to Depths of 2000 Meters | Watts Up With That?
Pingback: Alarmists Bizarrely Claim “Just what AGW predicts” about the Record High Global Sea Surface Temperatures | Bob Tisdale – Climate Observations
Pingback: Climate Models vs Real World Data | US Issues
Pingback: About the Claims That Northeast U.S. Blizzards Have Been Amplified by Human-Induced Global Warming | Bob Tisdale – Climate Observations
Pingback: About the Claims That Northeast U.S. Blizzards Have Been Amplified by Human-Induced Global Warming | Watts Up With That?
Pingback: Climate Propaganda from the Australian Academy of Science | Bob Tisdale – Climate Observations
Pingback: Climate Propaganda from the Australian Academy of Science | Watts Up With That?
Pingback: On Steinman et al. (2015) – Michael Mann and Company Redefine Multidecadal Variability to Provide the Answers They Want and Need | Bob Tisdale – Climate Observations
Pingback: On Steinman et al. (2015) – Michael Mann and Company Redefine Multidecadal Variability And Wind Up Illustrating Climate Model Failings | Watts Up With That?
Pingback: New Paper Confirms the Drivers of and Processes behind the Atlantic Multidecadal Oscillation | Bob Tisdale – Climate Observations
Pingback: New Paper Confirms the Drivers of and Processes behind the Atlantic Multidecadal Oscillation | Watts Up With That?