Global precipitation is a crucial part of our understanding of the global Water Cycle. The climate science community can’t hope predict how precipitation will change in the future without knowing how precipitation has varied in the past. The oceans are a crucial part of the water cycle. As the USGS notes in their webpage The Water Cycle: The Oceans:
It is also estimated that the oceans supply about 90 percent of the evaporated water that goes into the water cycle.
For land and oceans, NOAA presents three satellite- and rain gauge-based precipitation datasets that start in 1979, giving more than 3 decades of data. I’ve included 2 of them in past posts: (1) CAMS-OPI, which stands for Climate Anomaly Monitoring System (“CAMS”) and OLR Precipitation Index (“OPI”); and (2) Global Precipitation Climatology Project version 2.2 (GCPC v2.2). The third is CPC Merged Analysis of Precipitation (CMAP).
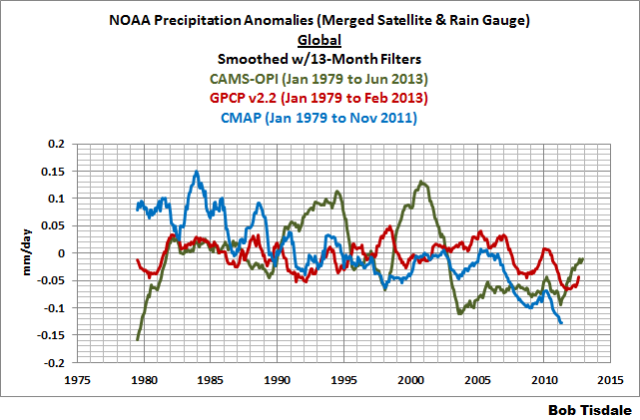
Amazingly, there are few to no agreements among the three datasets when looking at the global data. Each shows different annual variations, Figure 1. [Note: Only one of the three datasets is updated regularly at the KNMI Climate Explorer (CAMS-OPI), thus the different end dates of the data.]
Figure 1
And their trends are very different, Figure 2.
Figure 2
The CMAP data shows a large decrease in global precipitation anomalies from 1979 to 2009. The CAMS-OPI also shows a decrease, but it’s not as great as the CMAP data. And the GCPC v2.2 data shows basically no trend, when compared to the other two.
IS ONE OF THE DATASETS CLOSE TO BEING RIGHT?
Looking at the global combined land plus ocean data, one would be hard pressed to determine if any of the three global precipitation datasets are close to being correct. But there is a place where we may be able to get some insight. Because of El Niño and La Niña events, precipitation in the tropical Pacific is very volatile, but it should also follow a pattern: precipitation should increase during El Niños and decrease during La Niñas. And some El Niños should have stronger impacts on precipitation than others.
Figure 3 presents the CAMS-OPI, CMAP and GCPC v2.2 precipitation anomalies for the tropical Pacific. Again, the three datasets have been smoothed. Before 1987 and during the 1988/89 La Niña, the CMAP data is the outlier. On the other hand, the CAMS-OPI data diverges from the other two during the early 1990s and from 1998 to 2003. That leaves the GCPC v2.2 precipitation data.
Figure 3
The GCPC v2.2 precipitation anomalies for the tropical Pacific are compared to NINO3.4 sea surface temperature anomalies in Figure 4. Both datasets have been standardized (divided by their standard deviations). The NINO3.4 data reflect the impacts of El Niño and La Niña events on the sea surface temperature anomalies of a region along an east-central portion of the equatorial Pacific, and they are a commonly used index for the timing, strength and duration of El Niños and La Niñas. As shown, the GCPC v2.2 precipitation anomalies for the tropical Pacific mimic the variations in the NINO3.4 data. There are differences, but the tropical Pacific precipitation data are consistently responding to El Niño and La Niña events, as one would expect.
Figure 4
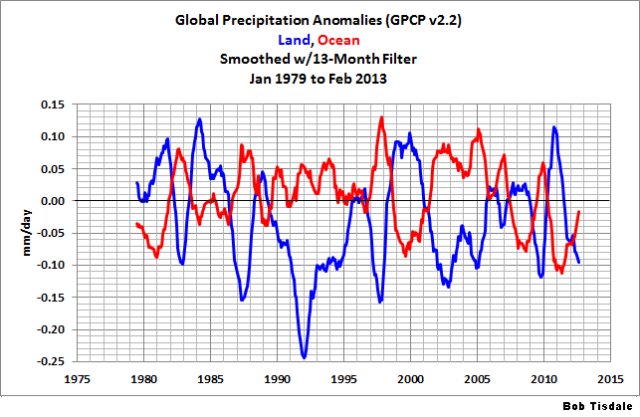
Those ENSO-related variations also carry to the global GCPC v2.2 precipitation data, but we have to isolate the land and ocean precipitation data. See Figure 5, which is from the post Models Fail: Global Land Precipitation & Global Ocean Precipitation. As noted in that post:
Looking at the global ocean precipitation anomalies (red curve), it’s blatantly obvious that the primary causes of annual precipitation variations are El Niño and La Niña events. The 1982/83, 1986/87/88, 1997/98 and 2009/10 El Niño events are plainly visible, and you can also make out the lesser El Ninos in the early 1990s and mid-2000s. The trailing La Niñas are also evident.
The opposing relationship between ocean precipitation and land surface precipitation is also obvious. Land surface precipitation generally drops in response to El Niños and increases during La Niñas. There is also a strong dip and rebound in the land surface precipitation data starting about 1991 that may be a response to the eruption of Mount Pinatubo. Curiously, the ocean data does not show a similar response.
Figure 5
Unfortunately, there are no land and ocean masks at the KNMI Climate Explorer for the CAMS-OPI and CMAP precipitation data, so we can’t see how they respond when broken down in similar fashions.
CLOSING
For global land plus sea surface temperatures, there is a reasonably close agreement among the datasets. No such agreement exists for global land plus ocean precipitation data.
Without knowing how precipitation has varied in the past, how then can climate modelers hope to be able to project changes in the future?
And if global precipitation is dependent on El Niño and La Niña events, climate models would have to be able to simulate the processes of ENSO. But after decades of modeling efforts, they still cannot simulate those El Niño- and La Niña-related processes. Refer to Guilyardi et al (2009) Understanding El Niño in Ocean-Atmosphere General Circulation Models: progress and challenges.


Pingback: researchers, outfoxed … | pindanpost