
The sea surface temperature anomalies in the NINO3.4 region of the equatorial Pacific (5S-5N, 170W-120W) are a commonly used metric for the frequency, strength and duration of El Niño and La Niña events. For the week centered on Wednesday April 16, 2014, they were about +0.33 deg C. That is, they’re still in ENSO-neutral conditions (cooler than +0.5 deg C but warmer than -0.5 deg C), which means they’re not in El Niño or La Niña conditions.
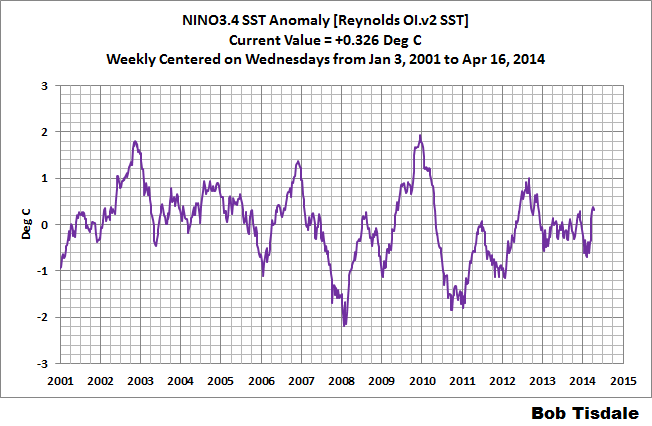
Weekly NINO3.4
In fact, the only NINO region with elevated sea surface temperatures last week was the NINO4 region at +0.68 deg C. NINO3 sea surface temperature anomalies were at +0.33 deg C and NINO1+2 region values were still quite cool at -0.59 deg C.
Global sea surface temperature anomalies are at about +0.29 deg C for the week centered on April 16th, compared to the base years of 1971-2000.
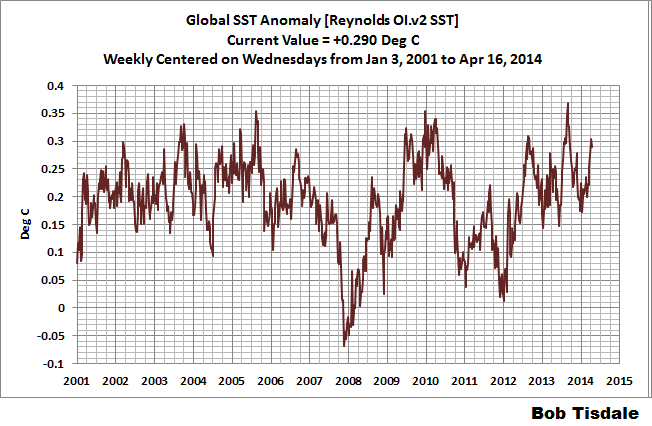
Weekly Global
INTERESTED IN LEARNING MORE ABOUT THE EL NIÑO AND LA NIÑA AND THEIR LONG-TERM EFFECTS ON GLOBAL SEA SURFACE TEMPERATURES?
Why should you be interested? Sea surface temperature records indicate El Niño and La Niña events are responsible for the warming of global sea surface temperature anomalies over the past 30 years, not manmade greenhouse gases. I’ve searched sea surface temperature records for more than 5 years now, and I’ve searched ocean heat content records for more than 4 years, and I can find no evidence of an anthropogenic greenhouse gas signal. That is, the data indicates the warming of the global oceans has been caused by Mother Nature, not anthropogenic greenhouse gases.
For further preliminary information, see the essay (pdf) titled The Manmade Global Warming Challenge. (It’s 42MB, but it’s free and worth the download time.)
Two years ago, I published my e-book (pdf) about the phenomena called El Niño and La Niña. It’s titled Who Turned on the Heat? with the subtitle The Unsuspected Global Warming Culprit, El Niño Southern Oscillation. It is intended for persons (with or without technical backgrounds) interested in learning about El Niño and La Niña events and in understanding the natural causes of the warming of our global oceans for the past 30 years. Because land surface air temperatures simply exaggerate the natural warming of the global oceans over annual and multidecadal time periods, the vast majority of the warming taking place on land is natural as well. The book is the product of years of research of the satellite-era sea surface temperature data that’s available to the public via the internet. It presents how the data accounts for its warming—and there are no indications the warming was caused by manmade greenhouse gases. None at all.
Who Turned on the Heat?was introduced in the blog post Everything You Ever Wanted to Know about El Niño and La Niña… …Well Just about Everything. The Updated Free Preview includes the Table of Contents; the Introduction; the beginning of Section 1, with the cartoon-like illustrations; the discussion About the Cover; and the Closing. The book was updated recently to correct a few typos.
Please buy a copy. (Credit/Debit Card through PayPal. You do NOT need to open a PayPal account.) Simply scroll down to the “Don’t Have a PayPal Account” purchase option. It’s only US$8.00 US$5.00.
SOURCES
The Sea Surface Temperature anomaly data used in this post is available through the NOAA NOMADS website:
http://nomad1.ncep.noaa.gov/cgi-bin/pdisp_sst.sh
or:
http://nomad3.ncep.noaa.gov/cgi-bin/pdisp_sst.sh?lite=


Thank you
Thanks Bob.
Thanks, Bob. This El Niño will be closely watched, it seems like it will have a lot to explain.
Pingback: March 2014 Global Surface (Land+Ocean) Temperature Anomaly Update | Bob Tisdale – Climate Observations
Pingback: March 2014 Global Surface (Land+Ocean) Temperature Anomaly Update | Watts Up With That?
The NINO region 3+4 is still below el nino territory and the SOI is officially positive for the month of April, +5.1 as of April 26. That means there won’t be an April el nino. I doubt it hits in May either. I’m thinking an official June-July-August el nino.