
This is a quick update on the status of the sea surface temperatures of the equatorial Pacific, along with a brief discussion of the recent excursion of the daily Southern Oscillation Index into El Niño conditions. Things are NOT looking good if you’ve been looking forward to an El Niño (California), and things are looking up if you don’t want one (Australia).
SEA SURFACE TEMPERATURES
Note: The NOAA NOMADS website is still off-line, so I used the weekly NINO region sea surface temperature anomaly data for Figures 1 and 2 from the NOAA/CPC Monthly Atmospheric & SST Indices webpage, specifically the data here. The data from NOAA NOMADS was provided with oodles of significant figures, while the NOAA/CPC data are provided in tenths of a degree C. The base years for anomalies through NOMADS were 1971-2000, while the NOAA/CPC data are referenced to 1981-2010. So that explains why the graphs are a little different than what you’re used to seeing.
Figure 1 includes the weekly sea surface temperature anomalies of the 4 most-often-used NINO regions of the equatorial Pacific. Of the four regions, the NINO3.4 region is the most widely referenced. From west to east they include:
- NINO4 (5S-5N, 160E-150W)
- NINO3.4 (5S-5N, 170W-120W)
- NINO3 (5S-5N, 150W-90W)
- NINO1+2 (10S-0, 90W-80W)
As of last week, the sea surface temperature anomalies in the NINO1+2 and NINO4 regions were still elevated but not abnormally so. In fact, the NINO1+2 data show a steady decline in sea surface temperature anomalies since their peak in mid-June. The NINO3 and NINO3.4 regions are at the +0.5 deg threshold of El Niño conditions, but they’ve been there before this year.

Figure 1
EL NIÑO EVOLUTION COMPARISONS FOR NINO REGION SEA SURFACE TEMPERATURE ANOMALIES
Using weekly sea surface temperature anomalies for the four NINO regions, Figure 2 compares of the evolutions of this El Niño with the 2002/03 and 2009/10 events.
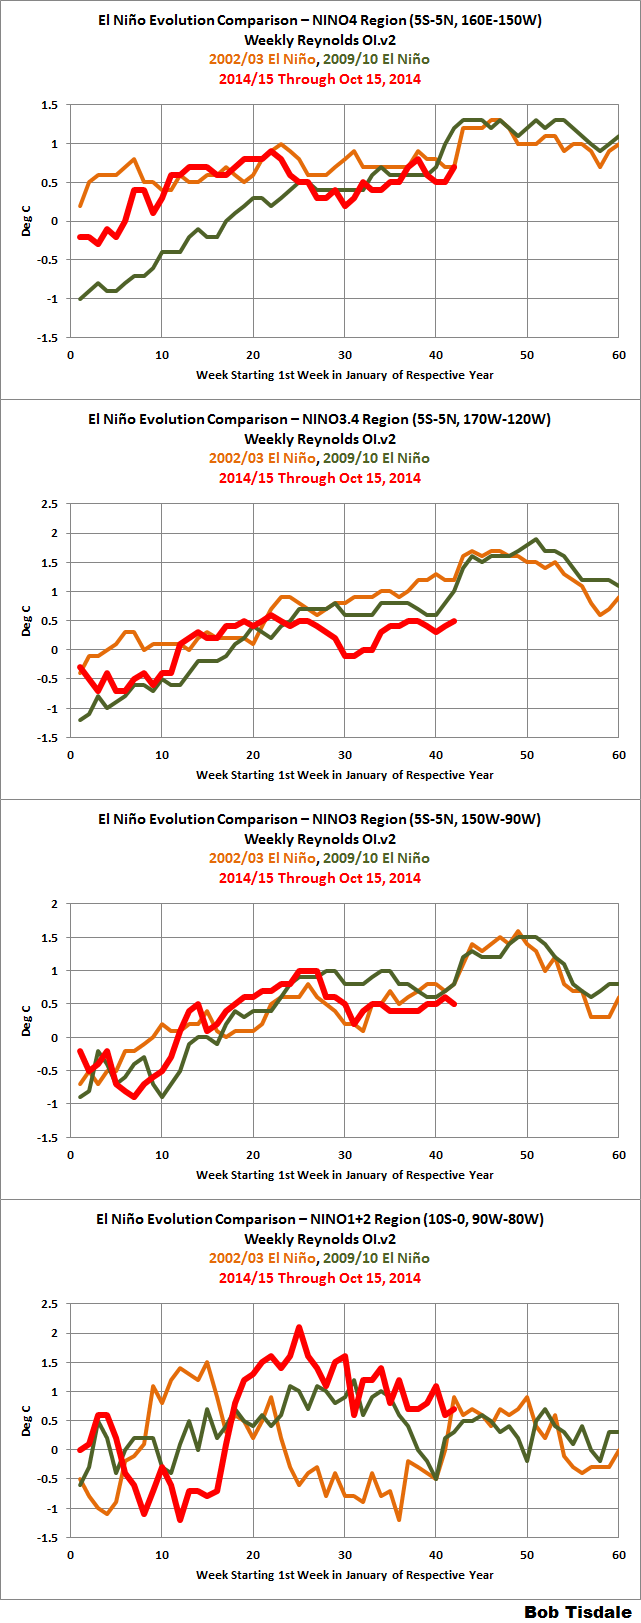
Figure 2
DON’T FORGET THE SOUTHERN OSCILLATION INDEX
The BOM Recent (preliminary) Southern Oscillation Index (SOI) values webpage shows the 30-day running-average of the SOI in ENSO-neutral conditions. However, the last few days are showing large excursions into El Niño territory. Is that evidence of westerly wind bursts in the western equatorial Pacific, or just off-equatorial weather noise?
Every week that goes by without a westerly wind burst along the equator in the western Pacific hurts the chances for an El Niño.
That’s all, folks.


Hi Bob,
thanks, again, for the very interesting information!
Looking forward to your report in a couple weeks on the SOI. Praying for a little good news here in So Cal. From what I have read, So Cal could still get some of the moisture if SOI picks up.
Thanks again Bob.
Thanks for the view, Bob.
This shy El Niño might not show up.
Bob,
This is not an ENSO question but one about the cool anomalies in the north Pacific and the north Atlantic on the UNISYS Current Sea Surface Temperature Anomaly Plot (from WUWT). Is this real or is there a data problem as some have suggested. This seems like such a rapid change over a great deal of sea surface.
Hi Sean. Unfortunately, the NOAA NOMADS system is down so I no longer have access to weekly sea surface temperature anomaly data. In addition to the Unisys color scaling being skewed toward cool colors, keep in mind that they switched sea surface temperature anomaly datasets this year so we have no past reference.
Also, the seasonal cooling in the weekly Reynolds OI.v2 SST maps doesn’t look as impressive:
http://www.emc.ncep.noaa.gov/research/cmb/sst_analysis/images/archive/weekly_anomaly/
Regards