
UPDATE 1 (June 2, 2012): Figures 7 and 8 in this post present data from an Ocean Heat Content anomaly dataset called UKMO EN3 that was available from the KNMI Climate Explorer for only a short time—a few weeks. I’ve discussed the dataset in the post UKMO EN3 Ocean Heat Content Anomaly Data Disappeared From The KNMI Climate Explorer As Suddenly As It Appeared. Please refer to it. As a general rule of thumb, all ocean heat content datasets have to be taken with a large grain of salt. There are simply too many problems with sensors (ARGO floats and XBTs), too many corrections, and before the ARGO era, the data is too sparse. The further back in time one looks, the more an ocean heat content dataset become a Northern Hemisphere dataset. But the uncorrected UKMO EN3 ocean heat content data used in Figures 7 and 8 have to be taken with an especially large grain of salt.
HHHHHHHHHHHHH
Dana1981 recently authored a SkepticalScience post titled Modeled and Observed Ocean Heat Content – Is There a Discrepancy? Believe it or not, in it, he complained about my comparison of modeled and observed ARGO-era Ocean Heat Content. See Figure 1. But his complaints do nothing more than misrepresent my graph and the modeled and observed trends of the Ocean Heat Content data. His intent is blatantly obvious. It is to mislead his readers. And it’s so obvious, it’s silly.
In this post, I’ll simply respond (once again) to complaints about that graph.
Dana1981’s initial reference to my graph comes in the opening sentence of his post. It reads:
Recently there have been a number of claims of a large discrepancy between modeled and observed ocean heat content (OHC), for example by Roger Pielke Sr., David Evans, and Bob Tisdale.
The post he linked was the WattsUpWithThat cross post of my most recent quarterly NODC Ocean Heat Content (OHC) update titled October to December 2011 NODC Ocean Heat Content Anomalies (0-700Meters) Update and Comments. The only model-data comparison graph in that post is Figure 1. So that simple graph is the only one he chooses to complain about.

Figure 1
Dana1981 uses the ridiculous heading of “Inaccurate, Unskeptical Graphs”. First, there’s nothing inaccurate about my graphs in general or Figure 1 specifically. The data for Figure 1 is available through the KNMI Climate Explorer, and the model projection is based on Hansen et al (2005). I include a detailed description of that graph in that post. Second, I’m not sure how unskeptical applies to a graph. Unskeptical according to MS Word means open minded. Whatever Dana1981 was yakking about, it’s nonsense. Figure 1 is an accurate presentation of the model projection and the data.
Dana1981 then goes on to write under that heading:
The first cherrypicks have already been discussed above – ignoring OHC below 700 meters, and ignoring the OHC increase prior to 2003.
Figure 1 appears in my post under the heading of “ARGO-ERA OCEAN HEAT CONTENT MODEL-DATA COMPARISON.” That limits the period of discussion, don’t ya think? There’s really no reason to include OHC data prior to 2003 in a graph of ARGO-era OHC data since ARGO floats had such poor coverage before then.
Dana1981 claims that presenting the NODC 0-700 meter OHC data is cherry-picking, apparently believing the NODC’s OHC data for depths of 0-2000 meters should be illustrated as well. There’s a very obvious problem with that logic, and Dana1981 fails to recognize it. The Hansen et al (2005) paper “Earth’s energy imbalance: Confirmation and implications” has been the reference all along in my series of OHC updates. It presents the NODC OHC data for 0-700 meters, not 0-2000 meters. Dana1981 even uses Figure 2 from Hansen et al (2005) as Figure 1 in his post.
Dana1981 then posts a graph from Tamino that represents the problems Dana1981 sees with my model-data presentation in Figure 1. We’ll overlook the obvious difference, which is that he’s looking at annual data and I’ve presented the data on a monthly basis. I’ve added a couple of notes to the SkepticalScience Figure 4 and posted that graph here as Figure 2. My graph in Figure 1 presents the extrapolated trend of the model mean. Tamino’s graph presents the trend for the annual Ocean Heat Content data, not the model mean. He also elected to show a trend for the data for the period of 1993 to 2002. But the period used in the Hansen et al (2005) paper that Dana1981 referenced was 1993 to 2003. The only reason to omit the 2003 data point is because the trend is lower without it. Then Dana1981 notes:
By choosing the baseline such that the models and data are equal in 2003, Tisdale and Evans have graphically exaggerated a model-data discrepancy.
So the point where the trend meets the data is Dana1981’s basic complaint. Yawn. Somehow in Dana1981’s mind the intercept makes the graph inaccurate and unskeptical. Dana1981 linked Tamino’s post Favorite Denier Tricks, or How to Hide the Incline, but he failed to also link my rebuttal here or the WUWT cross post Technical paper training for “Hansen’s Bulldog”. Dana1981 also failed to realize how the Corrections to the RealClimate Presentation of Modeled Global Ocean Heat Content impacted Tamino’s unfounded criticisms. So I’d better point it out to him.

Figure 2
Where should the model intersect with the data? Let’s take a look.
Dana1981 uses the uproariously funny heading of “Accurate Graph”. Dana1981 then presents the corrected RealClimate graph that compares model outputs and OHC data. The graph is from the RealClimate post OHC Model/Obs Comparison Errata. Yup, that was the first time in two and a half years that RealClimate posted an “accurate graph” in one of their OHC model-data comparisons. I’m not sure Gavin Schmidt liked being reminded of that fact by Dana1981, but I sure appreciated it. I’ve reposted the graph here and thrown on another question for Dana1981. It is: Where would an extrapolation of the model mean trend (1993-2003) intersect the NODC OHC data, Dana1981?

Figure 3
Gavin Schmidt was kind enough to post the answer to my question. He provided it when he corrected the OHC model-data comparison graph in his post 2011 Updates to model-data comparisons. See Figure 4. I’ve noted the answer on the graph. They don’t intersect. In my graph, Figure 1, the model and data at least intersect during the ARGO era but in the RealClimate graph that Dana1981 calls an “accurate graph” they don’t intersect. Would you rather I shifted the model trend to the left, away from the OHC data, Dana1981? Would that make it an “accurate graph” for you?

Figure 4
Figure 5 is the same OHC model-data comparison graph from RealClimate. In it, though, I’ve highlighted the ARGO era, which is the period I presented in Figure 1. I removed the NODC data for 0-2000 meters since it has no bearing on this discussion. I’ve also approximated Tamino’s linear trend of the NODC OHC data from 1993 to 2002 that Dana1981 would like us to believe represents the model mean. Does Tamino’s linear trend come close to representing the model mean? Nope! For some reason, things that are blatantly obvious to most of us elude Dana1981 and his cohorts at SkepticalSeance.

Figure 5
What Dana1981 failed to realize is, when Tamino pulled the two sleights of hand with that graph (using the data instead of the model mean and using the trend of the data from 1993 to 2002 instead of 1993 to 2003), the erroneous data that RealClimate was posting at the time, Figure 6, was aligning with the bogus Tamino trend. That erroneous model trend only made it appear that Tamino’s presentation was right. But it never was.

Figure 6
I was going to overlook Dana1981’s complaint that I was neglecting a raft of other sources of OHC data, but I’ve decided to respond to it. I use the KNMI Climate Explorer as the source of data for my quarterly Ocean Heat Content updates. That fact is discussed in the first few paragraphs of those OHC updates. It’s tough to miss it, being right up front. I use data that’s readily available from KNMI in my posts for a reason: so that anyone can reproduce my graphs. Up until a few weeks ago, the NODC Ocean Heat Content data for 0-700 meters was the only updated Ocean Heat Content dataset available at the KNMI Climate Explorer. I would have been more than happy to include other OHC datasets, but there haven’t been any—until recently.
KNMI recently added an Ocean Heat Content dataset based on the UK Met Office EN3 analysis. I haven’t really investigated that dataset in depth (pardon the pun) so I haven’t prepared a full post about it. Figure 7 compares the UKMO EN3 data to the NODC ARGO-era OHC data for 0-700 meters and also to the GISS model trend. The UKMO EN3 data appears similar to the NODC’s ARGO-era OHC data before the NODC’s 2010 modifications. I’ll confirm that in an upcoming post. If you haven’t noticed, the trend of the ARGO-era UKMO EN3 OHC data (0-700 meters) is negative from January 2003 to March 2012.
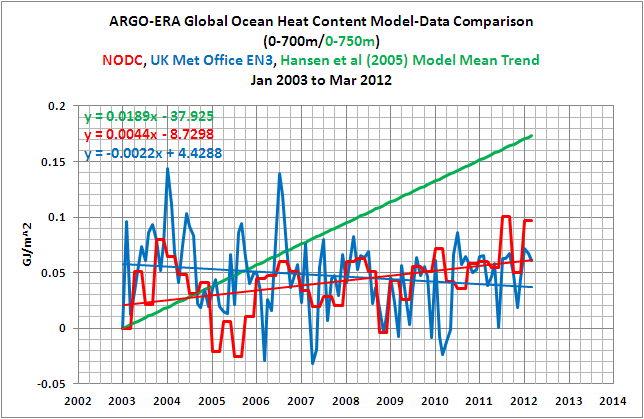
Figure 7
The UKMO EN3 OHC data is presented in 4 depths at the KNMI Climate Explorer: 0-400m, 0-700m, 0-1000m, and 0-2000m. We can compare the global ARGO-era 0-2000 meter UKMO EN3 data to the trend of the GISS model mean for 0-750 meters, Figure 8. The models are still out of the ballpark. There’s no reason to search for the GISS model trend for 0-2000 meters to illustrate that point.

Figure 8
CLOSING
When Gavin Schmidt published those corrections to the RealClimate OHC model-data comparisons, I believed that no one would be foolish enough to ever again complain about where the OHC model trend and data intersected in my ARGO-era graphs. But I was proved wrong. Dana1981 raised the bar on foolishness. And his readers went along with it.
Roger Pielke Sr. also published a post yesterday about Dana1981’s OHC post. Roger’s post is titled Grappling With Reality – A Comment On The Skeptical Science Post By Dana1981 “Modeled and Observed Ocean Heat Content – Is There a Discrepancy?” Yup, Dana1981 and many of the commenters on that SkepticalScience thread are grappling with reality, but they’re losing the wrestling match.
By the way, Dana1981, thanks for allowing me to post the ARGO-era model-data comparison graph once again. It’s one of my favorites.


My impression of this particular troll ‘dana1981’ is that he lacks both maturity and intelligence. Until he arrived at SkS I had a modicum of respect for John Cook. One would think that John Cook would view his frequent, repetitious and uninformed attacks on Richard Lindzen as embarrassing. I fear that scientists like Roger Pielke Sr. are giving him more attention than is warranted.
Alex, maybe the attention will open John Cook’s eyes to just how ridiculous the posts at SkepticalScience have become. Then again, he may be well aware of that fact and is using those nonsensical posts as diversions from reality, with hope of keeping his funding.
It may be obvious to you, but something that should be emphasized for your readers is that the CHANGE in OHC is a direct reflection of heat energy gained by the ocean, and that the offset or baseline chosen for the lines does not affect that.
Or in other words, what you are comparing is the slope of the OHC data vs slope of OHC projections and the baseline has no effect on that comparison.
The oceans absorb about 90% of all heat gained by the entire earth system. The change in OHC of the upper 700 meters seems to be about 2/3 of the total ocean OHC. The only place for which we have truly reliable data is for the upper 700 meters of the ocean, for the time since 2004. A good high-level description of your comparison is that you are comparing model projections vs. the only complete, accurate observed data we have for heat change.
dana1981 at 02:50 AM on 25 May, 2012
Also kudos to Gavin Schmidt for so quickly noting and correcting the mistake in his prior model-data comparison posts. That’s how true skeptics behave.
Just goes to show how confused dana1981 truly is, Cary.
In the data of 0…700m OHC I found an interesting fact in my eyes. I looked at the hemispheric data 0…90 deg N and -90…0 deg N and I saw that the OHC in the northern hemisphere droped down since 2006 or so and not so in the southern hemisphere. So I calculated the difference and this is the most interesting fact: Since 1990 the OHC of the NH was greater than this of the SH and in the last month this difference is near zero again. We know, that the modern warming is almost a warming of the NH and so increased the OHC. What can it mean, that the difference is now near zero?
Given claims that the “lost heat” is stored in the oceans, now evidently below 700 metres, how long will it be before we have sufficient measurements at deeper levels to determine observationally what is happening there?
Peter Kemmis, a couple of decades.
A couple of decades. Thank goodness. We won’t have to go searching for another sink for the lost heat, till about 2032. But I think the tide (of scientific opinion) will have turned well before then.
A couple of hours ago, I saw a a post under “In Search of Himalyan Ice Loss” http://www.skepticalscience.com/news.php?n=1418 that was along the lines of “I’m glad we won’t see the Himalayan ice all gone by 2035” – a lovely tongue in cheek. Oddly enough, that cheeky post is no longer there. Sites that I respect are those that accept differing and often opposing viewpoints – that’s so necessary for genuine discussion. (Ad hominem and general abuse should of course be off limits.)
Thanks Bob, haven’t really delved into this ongoing “missing heat” issue before but did tonight and your post has proved illuminating. I think skeptical science gets away with a lot because most of their audience don’t even bother reading what they put up, they just presume everything is explained there hence the skeptics must be wrong. That’s too bad as you’ve shown.
As a general rule if you are going to offset match two linear series, do it in the middle. If you do it at either end then small variations in the slopes are magnified.
Eli Rabett: Regardless of where the two trends intersect, the trend of the model projection is still more than 4 times higher than the observed trend since 2003. As I have noted numerous times in the past, when someone publishes the model mean for the GISS Model-ER simulation of Ocean Heat Content, I’ll use the base years of 1955 to 2011 for the model-data comparison, and simply show them starting in 2003. That way no one could accuse me of cherry picking the base years. Wanna guess where the two curves should intersect with those base years? Just about where they intersect in Figure 1 above.
Regards.
Leaving aside the intricate narrative here of alleged offenses received and delivered, when I visit KNMI as suggested by Bob and pull various OHC graphs from 1955- as specified all I see is obviously increasing heat content over the period. Why should I care about the exact value of the slope?
dbostrom: The topic of discussion is the flatness of the Ocean Heat Content data during the ARGO era, not since 1955. And as noted on the graph, the question is, how many more years will it take to falsify the models if the difference between the model projections and observations were to continue? We’ve established numerous times and in numerous ways that the climate models used by the IPCC have no skill at being able to simulate the past variations in surface temperatures. Based on that, any assumption that the models have skill at projecting future climate is unwarranted.
This would be yet another way to confirm a lack of model skill.
Hmm. I see a number of “flat” periods interspersed all the way back to 1955 but there’s a trend concluding with “up” compared to 1955. Models say “up,” data says “up.” Where’s the problem, and why would prediction of interannual variation be useful?
Somebody surely must have plotted the model slope versus observational data slope over the entire available time span, 1950-. What does that look like?
Oh, I think I get it now. Your analysis appears to hinge on the infamous “step” in temperature, am I right?
Visible here:
http://climexp.knmi.nl/plotseries.cgi?id=someone@somewhere&TYPE=i&WMO=nodc_heat700_0-360E_-90-90N_n&STATION=NODC_0-700m_heat_content_0-360E_-90-90N&NAME=Index&KIND=yr0
dbostrom says: “Hmm. I see a number of ‘flat’ periods interspersed all the way back to 1955 but there’s a trend concluding with ‘up’ compared to 1955. Models say ‘up,’ data says ‘up.’ Where’s the problem, and why would prediction of interannual variation be useful?”
Where’s the problem? Did you miss Figure 4 above? I’ll save you the scroll time. Here’s a link. https://bobtisdale.files.wordpress.com/2012/05/figure-4.jpg
The models when hindcasting captured the “flat” periods and the captured the “up” periods. But the projection definitely failed to capture the recent flattening because they’re going “up” and the observations are not. And that’s the basis for the question in Figure 1.
I’m not sure why you’re arguing about this. Gavin Schmidt admitted the models didn’t work out once he made the correction.
http://www.realclimate.org/index.php/archives/2012/05/ohc-modelobs-comparison-errata/comment-page-1/#comment-236042
The comment and reply:
armando says:
22 May 2012 at 12:11 PM
That must (have) hurt: http://www.realclimate.org/images/ohc11.jpg
[Response: not really. I learnt a long time ago that a) I’m not infallible, and b) that one should never get personally invested in the results of a model. When things work, one should always remain pleasantly surprised, when they don’t there is possibly a reason that can found – which may be interesting. This is why science is fun. – gavin]
dbostrom says: “Somebody surely must have plotted the model slope versus observational data slope over the entire available time span, 1950-. What does that look like?”
It has no bearing on this discussion.
dbostrom says: “Oh, I think I get it now. Your analysis appears to hinge on the infamous ‘step’ in temperature, am I right?”
Nope. Far from it. First, the dataset being discussed and the graph you linked is not temperature. It’s ocean heat content. Second, the topic at hand is the model-data comparison starting in 2003. Scroll up to Figure 1. Do you see an “infamous ‘step’” in the data?
dbostrom says: “Visible here:
http://climexp.knmi.nl/plotseries.cgi?id=someone@somewhere&TYPE=i&WMO=nodc_heat700_0-360E_-90-90N_n&STATION=NODC_0-700m_heat_content_0-360E_-90-90N&NAME=Index&KIND=yr0”
I see no step in the graph you provided. I believe what you think are steps are caused by KNMI presenting quarterly data on a monthly basis.
Good bye, Doug. You’re wasting your time and mine.
Wow, you’ve got a very short fuse.
Ta!
One last thought: in between episodes of truncating data series, crafting selective quotations and making supercilious remarks, why not provide your readers w/a description of how OHC is deduced, particularly the relevance of temperature to the calculation?
dbostrom says: “Wow, you’ve got a very short fuse.”
Actually, it takes a lot to light my fuse. I’m moved to boredom much more easily.
With respect to your suggestion, I believe I’ve already done so or provided a link to a Levitus paper that explained it.
Bob: “I see no step in the graph you provided. I believe what you think are steps are caused by KNMI presenting quarterly data on a monthly basis.”
No, annual figures. The bumps in the earlier part of the decade are a hazard when it comes to choosing starting points, as you note in discussing Tamino’s graph: “The only reason to omit the 2003 data point is because the trend is lower without it.” The same problem would arise for somebody working w/data from the 1980s. In your case you appear to start at 2003, which will respectively change the shape of your graph.
What happens if your projection derived from observational data from your figure 1 in this post is started in ’93, as per Hansen, is then extended through to the most recent available data? It likely has a different slope.
My point here is that for people looking at this from a higher altitude than enthusiasts (most people, that is), the more data presented the more useful the result.
Also, taken together w/the comment you quoted, Gavin Schmidt’s conclusions in the OP at RC provide a fuller synopsis of the significance of his correction:
The basic picture is unchanged – model simulations were able to capture the historical variance in OHC (as best we know it now – there remains significant structural uncertainty in those estimates). There are clear dips related volcanic eruptions (Agung, El Chichon, Pinatubo), and an sharp increase in the 1990s. Note that in GISS-EH (same AGCM but with a different ocean model) OHC increases at a slightly slower rate than seen with GISS-ER above. Looking at the last decade, it is clear that the observed rate of change of upper ocean heat content is a little slower than previously (and below linear extrapolations of the pre-2003 model output), and it remains unclear to what extent that is related to a reduction in net radiative forcing growth (due to the solar cycle, or perhaps larger than expected aerosol forcing growth), or internal variability, model errors, or data processing – arguments have been made for all four, singly and together.
dbostrom says: “What happens if your projection derived from observational data from your figure 1 in this post is started in ’93, as per Hansen, is then extended through to the most recent available data? It likely has a different slope.”
Look at the heading of the section of the post where the graph was last used, dbostrom. That’s the WUWT cross post linked in the paragraph just above Figure 1 in this post.
The title is ARGO-ERA OCEAN HEAT CONTENT MODEL-DATA COMPARISON. I can’t start the graph in 1993 and still have it be ARGO era, now can I?
dbostrom says: “My point here is that for people looking at this from a higher altitude than enthusiasts (most people, that is), the more data presented the more useful the result.”
Your point has nothing to do with the time-period of the graph or its intent. You failed to grasp the purpose of the graph.
And thanks for posting the portion of Gavin’s post that you found pertinent. Let me repeat the last sentence, where he acknowledges the failure of the model:
What Gavin failed to say is that it’s a two-way street for many of the factors he listed. Some of those factors he notes could also have been responsible for much of the rise in ocean heat content from 1993 to 2003, a period Hansen et al (2005) attributed to anthropogenic forcing. And guess what? I’ve already presented that that is, in fact, the case. Most of the rise in ocean heat content during the period of 1993-2003 was caused by natural factors (“internal variability”) not modeled by GISS. All you have to do is divide the global oceans into logical subsets to see it. Refer to my post from two and a half years ago titled Why Are OHC Observations (0-700m) Diverging From GISS Projections?
The GISS Model-ER does not simulate ENSO or AMO/AMOC and those processes were responsible for much of the rise during that period.
Good-bye, Doug. What part of the first good-bye didn’t you understand? This isn’t an argument you’re going to win. You haven’t done your homework. As I said before, you’re wasting your time and mine.
It is indeed hard to say “good-bye.” 🙂
Thank you for posting my opinions alongside yours and cheerio!
Tisdale => 1
Dana => naDa. 🙂
Pingback: UKMO EN3 Ocean Heat Content Anomaly Data Disappeared From The KNMI Climate Explorer As Suddenly As It Appeared | Bob Tisdale – Climate Observations
Bob,
Out of interest, Dana Nuccitelli’s paper here: http://www.skepticalscience.com/big-picture.html now forms the official justification (here: http://www.carbontax.net.au/category/climate-change/ ) for Australia’s carbon tax of $23 per tonne that was introduced yesterday.
Dr A Burns: Thanks for the link. Looks like Australia, for now, has responded to a hypothesis that is supported by climate models but not by observations-based data. A pitty.