
Anthony Watts of WattsUpWithThat forwarded a link to a newly published peer-reviewed paper by Stefan Rahmstorf, Grant Foster (aka Tamino of the blog OpenMind) and Anny Cazenave. Thanks, Anthony. The title of the paper is Comparing climate projections to observations up to 2011. My Figure 1 is Figure 1 from Rahmostorf et al (2012).
The authors of the paper have elected to prolong on the often-portrayed myth about El Niño-Southern Oscillation (ENSO):
Global temperature data can be adjusted for solar variations, volcanic aerosols and ENSO using multivariate correlation analysis…
With respect to ENSO, that, of course, is nonsense.

Figure 1
The Rahmstorf et al (2012) text for Figure 1 reads:
Figure 1. Observed annual global temperature, unadjusted (pink) and adjusted for short-term variations due to solar variability, volcanoes and ENSO (red) as in Foster and Rahmstorf (2011). 12-months running averages are shown as well as linear trend lines, and compared to the scenarios of the IPCC (blue range and lines from the third assessment, green from the fourth assessment report). Projections are aligned in the graph so that they start (in 1990 and 2000, respectively) on the linear trend line of the (adjusted) observational data.
INITIAL NOTE
Under the heading of “2. Global temperature evolution”, in the first paragraph, Rahmstorf et al (2012) write:
To compare global temperature data to projections, we need to consider that IPCC projections do not attempt to predict the effect of solar variability, or specific sequences of either volcanic eruptions or El Niño events. Solar and volcanic forcing are routinely included only in ‘historic’ simulations for the past climate evolution but not for the future, while El Niño–Southern Oscillation (ENSO) is included as a stochastic process where the timing of specific warm or cool phases is random and averages out over the ensemble of projection models. Therefore, model-data comparisons either need to account for the short-term variability due to these natural factors as an added quasi-random uncertainty, or the specific short-term variability needs to be removed from the observational data before comparison. Since the latter approach allows a more stringent comparison it is adopted here.
In the first sentence in the above quote, Rahmstorf et al (2012) forgot to mention that the climate models used in the IPCC projections simulate ENSO so poorly that the authors of Guilyardi et al (2009) Understanding El Niño in Ocean-Atmosphere General Circulation Models: progress and challenges noted:
Because ENSO is the dominant mode of climate variability at interannual time scales, the lack of consistency in the model predictions of the response of ENSO to global warming currently limits our confidence in using these predictions to address adaptive societal concerns, such as regional impacts or extremes (Joseph and Nigam 2006; Power et al. 2006).
Refer to my post Guilyardi et al (2009) “Understanding El Niño in Ocean-Atmosphere General Circulation Models: progress and challenges”, which introduces that paper. That paper was discussed in much more detail in Chapter 5.8 Scientific Studies of the IPCC’s Climate Models Reveal How Poorly the Models Simulate ENSO Processes of my book Who Turned on the Heat?
THE MYTH CONTINUED
The second paragraph of Rahmstorf et al (2012) under that heading of “2. Global temperature evolution” reads:
Global temperature data can be adjusted for solar variations, volcanic aerosols and ENSO using multivariate correlation analysis (Foster and Rahmstorf 2011, Lean and Rind 2008, 2009, Schönwiese et al2010), since independent data series for these factors exist. We here use the data adjusted with the method exactly as described in Foster and Rahmstorf, but using data until the end of 2011. The contributions of all three factors to global temperature were estimated by linear correlation with the multivariate El Niño index for ENSO, aerosol optical thickness data for volcanic activity and total solar irradiance data for solar variability (optical thickness data for the year 2011 were not yet available, but since no major volcanic eruption occurred in 2011 we assumed zero volcanic forcing). These contributions were computed separately for each of the five available global (land and ocean) temperature data series (including both satellite and surface measurements) and subtracted. The five thus adjusted data sets were averaged in order to avoid any discussion of what is ‘the best’ data set; in any case the differences between the individual series are small (Foster and Rahmstorf 2011). We show this average as a 12-months running mean in figure 1, together with the unadjusted data (likewise as average over the five available data series). Comparing adjusted with unadjusted data shows how the adjustment largely removes e.g. the cold phase in 1992/1993 following the Pinatubo eruption, the exceptionally high 1998 temperature maximum related to the preceding extreme El Niño event, and La Niña-related cold in 2008 and 2011.
IT IS IMPOSSIBLE TO REMOVE THE EFFECTS OF ENSO IN THAT FASHION
Rahmstorf et al (2012) assume the effects of La Niñas on global surface temperatures are the proportional to the effects of El Niño events. They are not. Anyone who is capable of reading a graph can see and understand this.
But first: For 33% of the surface area of the global oceans, the East Pacific Ocean (90S-90N, 180-80W), it may be possible to remove much of the linear effects of ENSO from the sea surface temperature record, because the East Pacific Ocean mimics the ENSO index (NINO3.4 sea surface temperature anomalies). See Figure 2. But note how the East Pacific Ocean has not warmed significantly in 30+ years. A linear trend of 0.007 deg C/decade is basically flat.
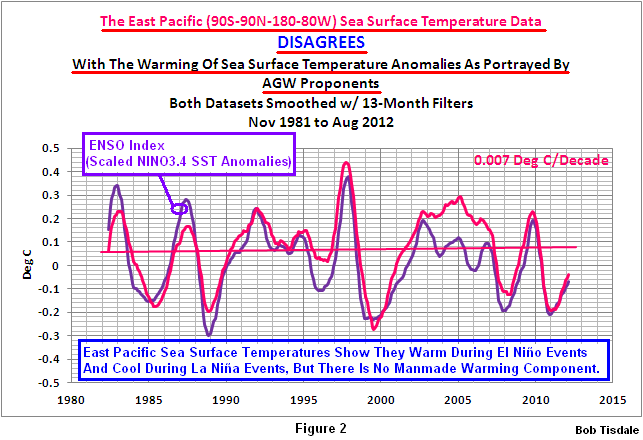
Figure 2
However, for the other 67% of the surface area of the global oceans, the Atlantic, Indian and West Pacific Oceans (90S-90N, 80W-180), which we’ll call the Rest of the World, the sea surface temperature anomalies do not mimic the ENSO index. We can see this by detrending the Rest-of-the-World data. Refer to Figure 3. Note how the Rest-of-the-World sea surface temperature anomalies diverge from the ENSO index during four periods. The two divergences highlighted in green are caused by the volcanic eruptions of El Chichon in 1982 and Mount Pinatubo in 1991. Rahmstorf et al (2012) are likely successful at removing most of the effects of those volcanic eruptions, using an aerosol optical depth dataset. But they have not accounted for and cannot account for the divergences highlighted in brown.

Figure 3
Those two divergences are referred to in Trenberth et al (2002) Evolution of El Nino–Southern Oscillation and global atmospheric surface temperatures” as ENSO residuals. Trenberth et al write:
Although it is possible to use regression to eliminate the linear portion of the global mean temperature signal associated with ENSO, the processes that contribute regionally to the global mean differ considerably, and the linear approach likely leaves an ENSO residual.
Again, the divergences in Figure 3 shown in brown are those ENSO residuals. They result because the naturally created warm water released from below the surface of the West Pacific Warm Pool by the El Niño events of 1986/87/88 and 1997/98 are not “consumed” by those El Niño events. In other words, there’s warm water left over from those El Niño events and that leftover warm water directly impacts the sea surface temperatures of the East Indian and West Pacific Oceans, preventing them from cooling during the trailing La Niñas. The leftover warm water, tending to initially accumulate in the South Pacific Convergence Zone (SPCZ) and in the Kuroshio-Oyashio Extension (KOE), also counteracts the indirect (teleconnection) impacts of the La Niña events on remote areas, like land surface temperatures and the sea surface temperatures of the North Atlantic. See the detrended sea surface temperature anomalies for the North Atlantic, Figure 4, which show the same ENSO-related divergences even though the North Atlantic data is isolated from the tropical Pacific Ocean and, therefore, not directly impacted by the ENSO events.
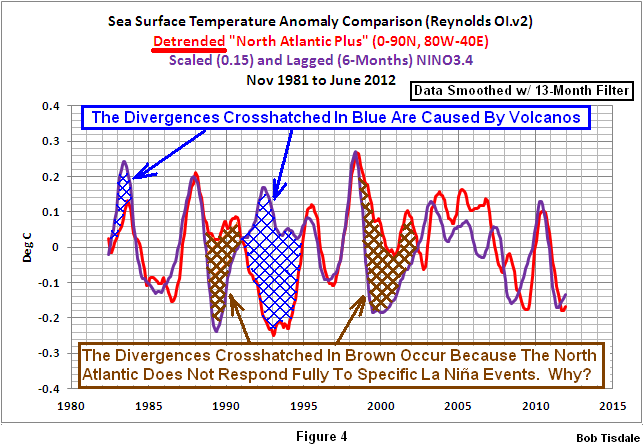
Figure 4
There’s something blatantly obvious in the graph of the detrended Rest-of-the-World sea surface temperature anomalies (Figure 3): If the Rest-of-the-World data responded proportionally during the 1988/89 and 1998-2001 La Niña events, the Rest-of-the-World data would appear similar to the East Pacific data (Figure 2) and would have no warming trend.
Because those divergences exist—that is, because the Rest-of-the-World data does not cool proportionally during those La Niña events—the Rest-of-the-World data acquires a warming trend, as shown in Figure 5. In other words, the warming trend, the appearance of upward shifts, is caused by the failure of the Rest-of-the-World sea surface temperature anomalies to cool proportionally during those La Niña events.
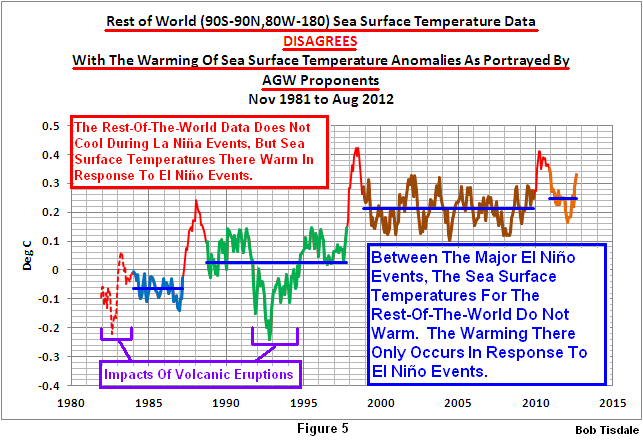
Figure 5
I find it difficult to believe that something so obvious is simply overlooked by climate scientists and those who peer review papers such as Rahmstorf (2012). Some readers might think the authors are intentionally being misleading.
FURTHER INFORMATION
The natural processes that cause the global oceans to warm were described in the Part 1 of YouTube video series “The Natural Warming of the Global Oceans”. It also describes and illustrates the impacts of ENSO on Ocean Heat Content for the tropical Pacific and the tropics as a whole.
Part 2 provides further explanation of the natural warming of the Ocean Heat Content and details the problems associated with Ocean Heat Content data in general. Part 2 should be viewed after Part 1.
And, of course, the natural processes that cause the oceans to warm were detailed with numerous datasets in my recently published ebook. It’s titled Who Turned on the Heat? with the subtitle The Unsuspected Global Warming Culprit, El Niño Southern Oscillation. It is intended for persons (with or without technical backgrounds) interested in learning about El Niño and La Niña events and in understanding the natural causes of the warming of our global oceans for the past 30 years. Because land surface air temperatures simply exaggerate the natural warming of the global oceans over annual and multidecadal time periods, the vast majority of the warming taking place on land is natural as well. The book is the product of years of research of the satellite-era sea surface temperature data that’s available to the public via the internet. It presents how the data accounts for its warming—and there are no indications the warming was caused by manmade greenhouse gases. None at all.
Who Turned on the Heat?was introduced in the blog post Everything You Ever Wanted to Know about El Niño and La Niña… …Well Just about Everything. The Updated Free Preview includes the Table of Contents; the Introduction; the beginning of Section 1, with the cartoon-like illustrations; the discussion About the Cover; and the Closing. The book was updated recently to correct a few typos.
Please buy a copy. (Credit/Debit Card through PayPal. You do NOT need to open a PayPal account.). It’s only US$8.00.
CLOSING
Rahmstorf et al (2012) begin their Conclusions with:
In conclusion, the rise in CO2 concentration and global temperature has continued to closely match the projections over the past five years…
As discussed and illustrated above, ENSO is a process that cannot be removed simply from the global surface temperature record as Rahmstorf et al (2012) have attempted to do. The sea surface temperature records contradict the findings of Rahmstorf et al (2012). There is no evidence of a CO2-driven anthropogenic global warming component in the satellite-era sea surface temperature records. Each time climate scientists (and statisticians) attempt to continue this myth, they lose more and more…and more…credibility. Of course, that’s a choice they’ve clearly made.
And as long as papers such as Rahmstorf et al (2012) continue to pass through peer review and find publication, I will be more than happy to repeat my message about their blatantly obvious failings.
SOURCE
The Sea Surface Temperature anomaly data used in this post is available through the NOAA NOMADS website:
http://nomad1.ncep.noaa.gov/cgi-bin/pdisp_sst.sh
or:


Sorry to bother you, but I find it quite necessary to ask: where does this El Nino heating come from? It’s energy we are talking about after all. El Nino seems to be just a facilitating mechanism, but the source must be something else. The fact that the net effect is an increase in temperature in successive steps, tells us there is an imbalance of some sort that causes this peculiar trend. I’m not saying it must be CO2 or mostly CO2; just that it seems to me you are not really addressing the issue, by focusing on ENSO cycles that require some preexisting cause for their contribution to a change in energetic balance.
AlphaT says: “where does this El Nino heating come from?”
From the La Nina or La Ninas before it!!!
Mother Nature has created a wonderful mechanism for varying the rate at which naturally created heat is released from, and redistributed from, the tropical Pacific.
Regards
PS: The process is described in detail in the part 1 of the video.
Actually, the video didn’t explain the original cause of these heating events.
This presentation, even while I found it very clear and interesting, sounds to me possibly similar to a lawyer saying: “Your Honor, my client is innocent of the crime he’s being accused. In fact, we are going to prove that the actual culprit was a handgun!”
In other words, either 1.the 95-96 freakish trade winds phenomenon and the ensuing very strong La Nina, were caused in a convoluted and indirect way, by another process that is some form of external component, a forcing; or 2.this ENSO-caused temperature variability is just a random walk, the climate realigns itself periodically for no reason other than chaos, possibly to higher average temperatures.
If 1., then I’d bet cosmic rays and cloud cover variations are in some way responsible; but you hardly addressed the assertions of AGW proponents: why can’t CO2 be involved? In a long presentation meant to specifically counter that idea, the key here is just your assertion that it is “obvious” that a 2-year temperature increase phenomenon can’t be ascribed to a CO2 increase spanning decades. Well, I don’t think CO2 is responsible either, but that’s hardly proven.
If 2., then we’d have a quite unstable climate system, where temperatures can increase consistently without even the need of a forcing: that’s an unexpected planet behavior, and one that suits the scaremongers’ “runaway climate” scenarios.
Pingback: Why Are Rahmstorf And Foster Wrong? The Same Reasons All The Models Are Wrong | suyts space
Pingback: Multidecadal Variations and Sea Surface Temperature Reconstructions | Bob Tisdale – Climate Observations
Pingback: Multidecadal Variations and Sea Surface Temperature Reconstructions | Watts Up With That?
Pingback: Tamino Resorts to Childish Attempts at Humor But Offers Nothing of Value | Bob Tisdale – Climate Observations
Pingback: Tamino Resorts to Childish Attempts at Humor But Offers Nothing of Value | Watts Up With That?
Pingback: Comments on Stefan Rahmstorf’s Post at RealClimate “What ocean heating reveals about global warming” | Bob Tisdale – Climate Observations
Pingback: Comments on Stefan Rahmstorf’s Post at RealClimate “What ocean heating reveals about global warming” | Watts Up With That?
Pingback: Trenberth and Fasullo Try to Keep the Fantasy Alive | Bob Tisdale – Climate Observations
Pingback: Trenberth and Fasullo Try to Keep the Fantasy Alive | Watts Up With That?
Pingback: An Odd Mix of Reality and Misinformation from the Climate Science Community on England et al. (2014) | Bob Tisdale – Climate Observations
Pingback: An Odd Mix of Reality and Misinformation from the Climate Science Community on England et al. (2014) | Watts Up With That?
Pingback: On Chylek et al (2014) – The Atlantic Multidecadal Oscillation as a Dominant Factor of Oceanic Influence on Climate | Bob Tisdale – Climate Observations
Pingback: On Chylek et al (2014) – The Atlantic Multidecadal Oscillation as a Dominant Factor of Oceanic Influence on Climate | Watts Up With That?