
OVERVIEW
In a number of posts, we’ve discussed and illustrated the difficulties with ocean heat content data. (There are links to those earlier posts at the end of this one.) The data presented in this post is supported by the 2012 Levitus et al paper World ocean heat content and thermosteric sea level change (0–2000 m), 1955–2010 [8.1 MB].
One topic discussed but not illustrated (until now in Figure 1) was that the annual variations in temperatures at depths between 700 and 2000 meters were in terms of hundredths if not thousandths of a deg C and that it was unrealistic to think we could measure the temperatures of the oceans at depth with that type of accuracy. It turns out that the annual variations are typically in thousandths of a deg C. The total scale of the temperature anomalies of the graph in Figure 1 is two one-hundredths of a deg C.
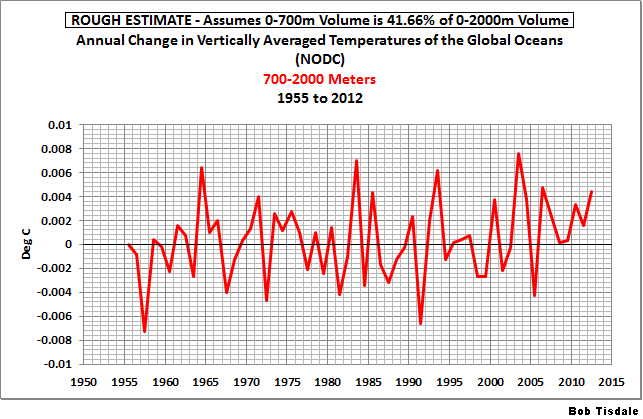
Figure 1
Keep in mind that Figure 1 presents the approximated changes in annual temperature for the depths of 700-2000 meters—not the anomalies. The annual changes are determined simply: by subtracting the value of the previous year from the value of the year being plotted.
The ocean temperature data for the depths of 700-2000 meters is an important topic. With the surface temperatures no longer warming and with the slowdown in the rate at which the oceans are warming at depths of 0-700 meters, climate scientists are now saying the missing heat is being forced to depths below 700 meters. Of course, that assumes the missing heat actually exists.
DATA AND METHOD
The NODC provides vertically averaged temperature anomalies for 0-700 meters here, and for the depths of 0-2000 meters here. To use that data to determine the variations in temperatures at depths between 700 and 2000 meters we need to know the volume of water in the depth ranges of 0-700 meters and 0-2000 meters. In reality, we don’t necessarily need the volumes. We can work with percentages.
According to an EPA document about ocean heat content data (here):
…the top 700 meters of the ocean (nearly 2,300 feet)…accounts for just under 20 percent of the total volume of water in the world’s oceans.
“[J]ust under 20 percent” could mean many things, so we’ll use the rounded figure of 20%.
Then on the last page of the NOAA presentation here, under the heading of “ARGO Future Possibilities”, they have the bullet point:
-52% of ocean volume below 2000 m
That obviously means that about 48% of the ocean volume is above 2000 meters.
Assuming those percentages are close to being correct, that means 41.66 % of the volume of the oceans to depths of 2000 meters comes from the top 700 meters and 58.33% at 700-2000 meters. I told you this was a rough estimate. So now we can use a simple weighted-average equation, where you solve for one of the components, to determine the changes in ocean temperature for the depths of 700-2000 meters. The result is illustrated above in Figure 1, and the data is presented as the annual change in temperature.
PUTTING THAT IN PERSPECTIVE
Figure 2 compares the annual changes in global sea surface temperature anomalies (HADSST3) and the vertically averaged temperatures of the global oceans to depths of 0-700 and 700-2000 meters.
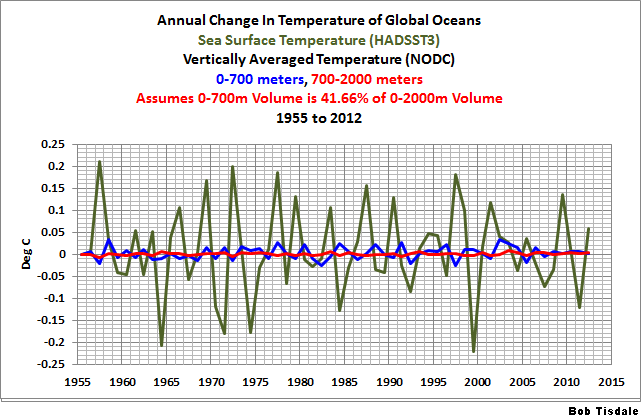
Figure 2
In Figure 3, the data has been returned to their standard time-series form and I’ve added global land+sea surface temperature anomalies (HADCRUT4) as a reference. All of the data have been zeroed at 1955.
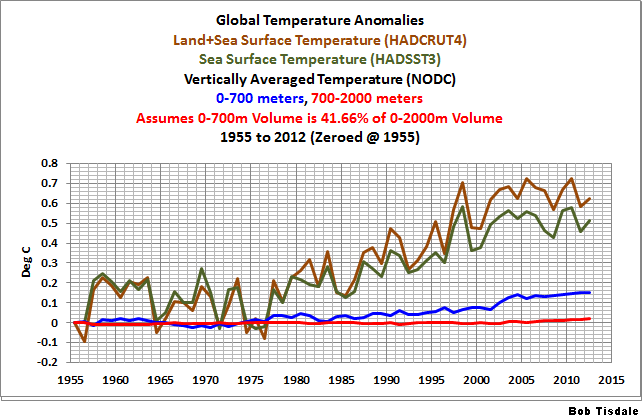
Figure 3
Many persons find it hard to believe that global surface temperatures can be estimated to the values shown. They’ll certainly have difficulty with the warming shown at depths of 700-2000 meters.
THE NODC’S HOCKEY STICK WHEN THEY TRANSITION TO ARGO DATA
Figure 4 presents the vertically averaged temperature anomalies for the global oceans for the depths of 700-2000 meters. They warm at a relatively constant and very slow rate until the ARGO floats begin the have complete coverage of the global oceans around 2003. Then they warm at a rate that’s almost 24 times faster than the rate seen in the 5 decades leading up to it.
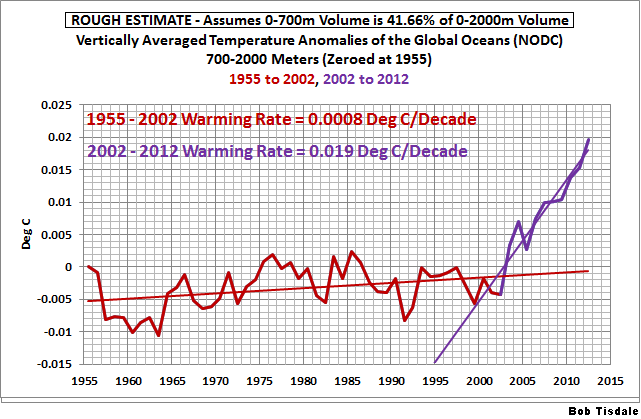
Figure 4
It doesn’t look very realistic, now, does it?
IS THE HOCKEY STICK DEPENDENT ON THE PERCENTAGES USED?
Let’s assume that the percentages I discovered online are wrong, and that the relationship of the volumes of the oceans at depths of 0-700 meters and 0-2000 meters is a linear one. That is, we’re going to assume that there are no continental shelves and that the volume of the oceans from 0-700 meters is 35% of the volume from 0-2000 meters (700/2000 = 0.35). Therefore, in our hypothetical example world, the volume of water from 700-2000 meters represents the other 65% of the depths from 0-2000 meters. Plugging those percentages into our standard weighted-average equation presents the curve shown in Figure 5. The hockey stick still exists, but it’s not as pronounced.

Figure 5
IS THE NODC FOOLING ITSELF WITH THE PENTADAL DATA?
Or are they trying to fool us?
In past posts (here and here), we showed how the NODC increases the warming rate of their ocean heat content data by presenting it in pentadal form. See the comparison graphs at depths of 0-700 meters (here) and 0-2000 meters (here). Figure 6 compares the roughly estimated vertically averaged temperature anomalies for the global oceans, for the depths of 700-2000 meters, from 1955 to 2012, in annual and pentadal forms. The same percentages of ocean volumes at depth (0.4166 for 0-700 meters and 0.5833 for 700-2000 meters) were applied to calculate both. In this comparison, I did not smooth the annual data because I wanted the break point in 2002 to be visible.
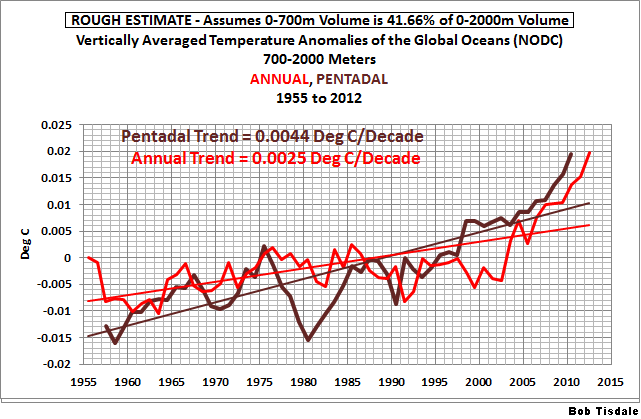
Figure 6
Not only does the data in pentadal form have a significantly higher warming rate, but its curve bears little resemblance to that of the annual data.
CLOSING
To account for the slowdown the warming of surface temperatures and in the heat content of the upper 700 meters of the global oceans, the climate science community is claiming manmade global warming is bypassing those levels and warming the oceans at depths below 700 meters. But that warming of the subsurface temperatures of the global oceans from 700-2000 meters represents variations measured in thousandths of a deg C. It is not reasonable to think we can measure the temperatures of the global oceans to that accuracy. Now consider that ocean heat content data have to be adjusted—tweaked, modified, corrected, whatever—in order for it to show warming during the ARGO era. (The UKMO EN3 data in the graph here should represent the uncorrected ARGO era data for depths of 0-2000 meters.)
The vertically averaged temperatures for the depths of 700-2000 meters can be approximated from their data for the depths of 0-700 and 0-2000 meters. It shows a very sudden shift in the rate of warming for depths of 700-2000 meters. The shift coincides with the introduction of the ARGO floats to rarely sampled portions of the global oceans—the mid-to-high latitudes of the oceans of the Southern Hemisphere, for example. This suggests that the warming presented by the data at those depths may result from the more-complete sampling of the global oceans.
We’ve discussed the problems with ocean heat content data in numerous posts over the past few months. They include:
Is Ocean Heat Content Data All It’s Stacked Up to Be?
Ocean heat content for the depths of 0-2000 meters is not a dataset in which one should have any confidence. It appears that it was introduced solely so that global warming enthusiasts could claim global warming continues.


Bob: Did you see my replies on the other threads over at WattsUp?
Hi RichardLH. Yup. I noticed them. But, as I’ve mentioned before, I don’t have the time to study something new to me at this time.
Regards
That’s OK. Should be fun watching what happens – if anything.
RichardLH: Consider opening your own blog through WordPress or Google so that you can provide more detail about what you’re showing.
Regards
I have tried to avoid that as I know and appreciate just how much time and effort hosting a blog takes.
I remember, back in the day. running FAQs and bulletin boards took way too much of my time. Fun but very time consumming.
All I have done is taken the dust off an old analogue audio/rf circuit (which is well known and understood) and applied it to the digital world (and Climate Science).
I didn’t know that was what I was building when I started out, but once I saw clearly what I was doing, it allowed me to be then confident in what it was showing me.
Noise is always a problem in signal work. And fundamental frequencies. Need to get rid of both wiithout destroying what is left. This does that with surgical precision.
The rest is just exuberance and adrenaline I’m afraid.
If I had understood what I was doing at the start this would all have been much more coherent.
Sorry.
With your permission (please delete if you do not wish to do so) I will post here what I have posted elsewhere as regards the tool and what it is/does.
—
Ideal digital sampling series for a bandpass splitter in Climate research.
next = rounded(previous*1.3371) starting from 3 or 1.
It precisely ‘nulls’ the 12 month signal whilst leaving all of its harmonics and all other frequencies intact.
(The same applies to any sample frequency that has one of the later poles as its direct multiple.)
This is a digital implementation of a ‘brick wall’ cascaded low pass/bandpass splitter circuit (approx 1/3rd octave).
As it is a digital average, it has a ‘square wave’ sampling methodology on the source data.
The well known side effects of this ‘square wave’ sampling are cancelled out by using the 1.3371 inter-stage multiplier.
On the plus side, it has a infinite(?) roll off per octave between stages so the bands are precise, though not tunable.
Also, as it is completely de-tuned in the passbands, it is completely insensitive to internal data distribution ‘in band’.
On the digital side, this is just the well known 3 pole filter arrangement which running means require, extended to the full cascaded filter set.
It can be used on either normalised (at 12 months) or non-normalised data.
When used as a simple 3 stage filter on daily data it can provide a 28 day smooth which is more scientifically accurate than a human Monthly one.
When looking at temperature data, this series and circuit should be used rather than Normals of any period.
Because of the 4 year period it discovers in temperature series, Yearly Normals should be discarded.
When used in Splitter mode (each stage subracted from the previous stage) it provides a ‘DC’/zero referenced view of each passband.
The final stage can be set to ‘DC’/zero or a ramp as required for any very long term trends (such as CO2).
Nodes can be extracted by using, -previous*next between each stage, or other such similar arrangements.
RMS power can be extracted from each passband in the normal way.
The maximum period that can be discovered by this method is limited by the record length and this is a power series.
Getting very long cycles will require correspondingly much longer input data!
Also worth noting, the period length limit appears to be the reciprocal of Nyquist as 1/period = frequency.
Fig 1

Fig 2

Fig 3

A ‘spreadsheet’ verification model exists as, by definition, the sum of all of the stages outputs will always equal the input.
The ‘power’ left to be assigned to any long term, yet to be discovered cycles, ramps or theories, can be determined and/or accounted for.
Also very puzzling, Why does 12,28,37 and 48(9) which are the main components of gravity fields here on Earth (i.e. Lateral as well as Vertical tides) show up both in the series and in nature?
Co-incidence? With 4 points of match I would have said not.
P.S. I always wondered why the Ancients had a 37 month Calendar. I think we should never underestimate the observation powers of the past. Their conculsions maybe, but their observation skills were probably better than ours today – unfortunately.
Observation and logic. Skills worth preserving and practicing.
And if, from the various displays, you do not think that this ‘proves’ that there is Global Temperature ‘natural regulator’ set at about +-0.1C (which is the range that the various bands are showing as common) and that that might provide a quide as to how many long term cycles are yet to be accounted for if you assume that? QED?
Including any long term downward travelling ‘wave’ of temperature into the depths (to bring this all back to the tread – finally – sorry).
If the ‘power’ is not there at the extreme end of the frequency bands so far resolved, then there is nothing left to be accounted for! That might be a problem.
RichardLH, I enjoy your enthusiasm. But I just wanted to let you know, my traffic here is very small compared to WUWT. And most of the people who visit here are interested in specific items that I address. Unfortunately, what you’re presenting is not one of them. Just thought I should let you know.
Again, consider opening your own blog and then working to create traffic.
Regards
Pingback: Are Oceans Warming While Global Surface Temperatures Are Stalling? | The Global Warming Policy Foundation (GWPF)
Bob: Again I am sorry.
It is just such a new toy. A nice engineering tool. Enthusiasm as you say. Nothing more intended.
Hallo Bob
are you aware of any mechanism that would transport serious amounts of warm water to below the thermocline? I’m asking because I’m convinced that the direct influence of solar warming is restricted to the top ~200m of the oceans. Below the thermocline is no serious warming from above possible imo, only cooling by denser water sinking, mostly at high latitudes.
Do you agree?
Ben Wouters: For example, consider the Gulf Stream. It’s driven northward by the trade winds in the tropics. But Gulf Stream transport also depends on surface winds at higher latitudes. They can enhance the poleward transport or they can resist it. If the flow from the tropics toward the poles were to remain constant, but the high latitude winds resisted the poleward transport, then the warm water could be forced to greater depths, lets say at mid-latitudes.
Regards
Thanks for your quick reply Bob.
What is the maximum depth (approximately) where these wind effects can still be seen?
I’m looking for mechanisms that could warm all of the oceans BELOW the thermocline, let’s say below 1000m by whole degrees.
I’m stuck in a discussion because my discussion partners believe that by conduction the deep oceans will warm up to the same temperature as the surface if the cooling at high latitudes wasn’t counteracting this. My position is that there won’t be conduction below the thermocline.
regards
Bob,
This is cross posted from WUWT for the benefit of Ben Wouters @ July 6, 2013 at 10:17 am.
Ben,
Please stop thinking that the density of seawater is determined solely by temperature. It is not, because seawater contains dissolved salts the degree of salinity also controls seawater density. It is perfectly possible to have a warm dense salty seawater body, such as Mediterranean Bottom Water, capable of sinking below the colder but less dense Atlantic seawater where these two water bodies meet as happens in the Gulf of Cadiz. Meddy image GOLR012.
Ok let’s talk about the down-welling of warm water. First some basics; warm water is less dense than cold water and in the Oceans, seawater is layered by density. From this we deduce that the water at the bottom of the ocean is always colder than that above, because the coldest water in a particular water column always has the greatest density. Is this correct?
Well actually this is not correct, because the ocean is not a uniform body of fresh water; it is complex association of salt water bodies with different origins and mixing histories. With seawater it is perfectly possible to have a body of warm haline that is denser than a colder but less haline one. If ocean currents bring these two distinct water bodies together in a zone of convergence, then the warmer saltier and more dense water will sink below the colder but less haline water, in a zone of dense warm water down-welling.
In meteorology we know that air masses are created with distinctive properties of temperature and humidity by the environmental conditions of their source area, so too in the oceans seawater masses are created with distinctive properties of temperature and salinity by their environment of origin. For example the modern Red Sea Bottom Water (RSBW) has a temperature of +21.7C and a salinity of 40.6 psu, this means that the RSBW has a density of 1028.595 kg/m3. By contrast Antarctic Bottom Water (AABW) has a temperature of -0.8C and a peak salinity of 34.7 psu. This means that the coldest sea water on the planet, which has a density of 1027.893 kg/m3, is less dense than Red Sea Bottom Water. In a straight fight between these two marine waters the Red Sea Bottom Water would win and the deeps of the ocean would be filled with warm oxygen poor bottom water from the tropics and not cold oxygenated water from the polar seas.
Sorry to labour the point but this is crucial for what follows next. Ok you say but the Red Sea does not influence the temperature of the ocean deeps in the modern world. True, the Red Sea is restricted in its access to the Indian Ocean, but notice that under modern atmospheric conditions the Red Sea easily creates and maintains a body of warm bottom water more dense than that of the AABW. Notice too that half the surface area of the planet lies between 30N and 30S, so it terms of size the marine Tropics and not the marine Polar region predominates. The controlling Thermo Haline Circulation process (warm Tropics or cold Polar) that determines the temperature of the deeps during a given geological age is merely an accident of ocean basin geography.
I have personal observation and experience of warm water down-welling, which is how I became interested in the whole subject of ocean water movement and the mechanics of the Thermo Haline Circulation (THC). Let me introduce you to a part of the modern tropics, the Atlantic Ocean archipelago of the Turks and Caicos Islands. In 1991 I had the good fortune of going on a geoscience field trip to West Caicos to study a modern open ocean carbonate platform environment. The Caicos archipelago is located on the Tropic of Cancer in a dry part of the West Indies where the climate is dominated by the warm dry North East Trade Winds blowing out from the Horse Latitudes anticyclone of the Hadley Cell situated to the north.
The combination of the dry trade winds, the extensive shallow water platform and the tropical sun means that the Caicos lagoon acts as a giant solar energy collector. In the lagoon, which has an area of some 2,000 sq. km and a water depth of no more than 10 metres, the tropical sun warms the sea water, the dry trade winds enhance evaporation concentrating the seawater and increasing the salt water density. The trade winds then blow this warm dense water across the platform lagoon to the west, where we find the tiny island of West Caicos.
West Caicos is a superb microcosm of a modern platform island undergoing carbonate deposition. As part of our exploration of the island’s environment we swam out from the west side across the coral reef flat to the platform edge. Over the reef the waters were warm, but as soon as we got the reef limit the water temperature suddenly dropped and I experience severe cramp in both legs. Fortunately I was wearing a life jacket and so no harm was done, but the experience was so dramatic and the impression so strong that I determined to find out what had happened to the warm water.
My researches led me to the following. In her paper: The Maastrichtian Late Cretaceous climate in the Northern Hemisphere Golovneva, L.B. (2000) deals with the high Arctic of the late Cretaceous and clearly establishes the principle of mode of THC at that time. She states (p51):-
As explained by Golovneva, in the absence of a polar ice cap (in either hemisphere) the bottom waters of the world ocean must be dominated by the thermo-haline circulation of warm dense marine brines sourced in the low latitude shallow waters of epeiric seas and continental shelves, for example those seas associated with the tropical margins of the Tethys Ocean.
At Caicos this process occurs today in miniature within an open ocean lagoon in the tropical Atlantic. I now know that the wind driven warm dense water created in the shallow waters of the Caicos lagoon falls away at the western drop off of the platform to be replaced at the surface by colder but less dense open ocean water that surrounds the archipelago and I believe that this marine warm water down-welling process is a fundamental feature of tropical latitude shallow water carbonate shelves located beneath the Hadley Cell. It is probably no coincidence that the world free diving record was set at Providenciales where the surface warm water current exits from the Caicos platform.
The modern Red Sea Bottom Water with its temperature of +21.7C shows how this mechanism of tropical solar energy capture and heat distribution by deep marine water was maintained in the past. The THC process of tropical warm water down-welling accounts for both the high average atmospheric temperature of the global climate for the Cretaceous and also explains the high Carbon Dioxide concentration in the atmosphere at that time.
Reference:
L. B. Goloyneya (2000) The Maastrichtian (Late Cretaceous) climate in the Northern Hemisphere. In Hart, M. B. (ed.) Climates: Past and Present. Geological Society. London. Special Publications, 181, 43- 54, 1-86239-075-4
Ben Wouters says: “What is the maximum depth (approximately) where these wind effects can still be seen?”
Ben, when I wrote my reply, I was thinking of Lozier et al (2008):
http://www.sciencemag.org/content/319/5864/800.abstract?rss=1
And the ScienceDaily article associated with it:
http://www.sciencedaily.com/releases/2008/01/080103144416.htm
They studied ocean heat content data at depths of 0-700 meters and 0-2000 meters,
The curious part: Lozier et al (2008) was based on the old NODC ocean heat content data, before they deleted the hump. So the hump was explainable with natural factors, yet it was deleted because the climate models couldn’t reproduce it.
Regards
Philip Mulholland says:
July 6, 2013 at 4:14 pm
Hallo Philip
thanks for your extensive reply. I have been looking at the THC, and found no indication that it can transport LARGE amounts of warm water to the deep oceans, to the contrary.
Have a look at these cross-sections of the oceans, especially the salinity views: http://earthguide.ucsd.edu/earthguide/diagrams/woce/
No high salinity water anywhere in the deep oceans.
Also this essay by Dr. Stevenson is clear imo: http://www.21stcenturysciencetech.com/articles/ocean.html
(especially the part “What about Thermohaline Circulation?”)
Small scale warming is of course possible, but warming the deep oceans by eg. 15K is not going to happen by the THC imo.
Funny that you mention the Cretaceous. I have been looking at that period myself, and I can assure you that the high temperatures of the deep oceans (below 1000m) in that period have nothing to do with the THC.
Hello Bob
Perhaps a bit of topic, but are you aware of this deep ocean (<1000m) temperature reconstruction?
http://onlinelibrary.wiley.com/store/10.1029/2011JC007255/asset/supinfo/jgrc12191-sup-0010-fs09.pdf?v=1&s=79e93e124ca1fd8a33753fc667ff17deaa20b3e6
It shows that ~82 mybp the temperature of the deep oceans was ~17K higher than today.
Puts the discussion about present OHC in a whole new perspective 😉
The explanation for these temperatures is embarassingly simple, and has nothing to do with CO2 or a greenhouse effect.
Notice that the temperature on average has dropped 1K every ~5 million years, and simply explains why we are in a glacial era today, with alternating ice ages and interglacials.
I'd like to discuss my ideas, but they are of topic for this post imo.
Perhaps contact me via my provided email address.
Regards
Ben Wouters
Ben Wouters: Thanks for the link to the paleo reconstruction. If I may, I’d like to personally bow out of any discussion of paleoclimatological data. Please feel free to provide links for others, but my interest is satellite-era SST data and OHC data for the last 55 years.
Regards
Hello Bob
I get your point, but I’m convinced that to understand our present climate (and the reason our temperatures are so much higher than solar radiation alone can explain) we have to look at the past.
Let me explain: looking at your figure 1 above we see a basically flat temperature for the deep oceans the last 50 years. This is surprising, since the geothermal flux through the crust (~100mW/m^2) is enough to warm ALL ocean water ~0,01K every 50 years. Further we have magma erupting near plate edges, vents etc.etc. So all this warming must be counter balanced by a cooling process. This can only happen at high latitudes, were the surface temperature is equal to the temperature of the deep ocean, and no ice cover prevents this cooling.
This whole warming / cooling has been going on for the last ~82 million years, and the deep oceans have lost 17 WHOLE degrees in that period.
So whatever caused the warm deep oceans in the first place is a major climate driver, and it has nothing to do with CO2 or other greenhouse gasses. So I’m pretty confident I have a better explanation for our temperatures being above the Effective Temperature of 255K than the greenhouse theory.
I’d like to discuss my ideas with someone who has a good understanding of how the oceans work.
That’s why I turned op at your site 😉
Pingback: Part 2 – Comments on the UKMO Report “The Recent Pause in Global Warming” | Bob Tisdale – Climate Observations
Pingback: Part 2 – Comments on the UKMO Report “The Recent Pause in Global Warming” | Watts Up With That?
Pingback: AMAZING: The IPCC May Have Provided Realistic Presentations of Ocean Heat Content Source Data | Bob Tisdale – Climate Observations
Pingback: AMAZING: The IPCC May Have Provided A Realistic Illustration | Watts Up With That?
Pingback: Dana Nuccitelli Can’t Come to Terms with the Death of the AGW Hypothesis | Bob Tisdale – Climate Observations
Pingback: Dana Nuccitelli Can’t Come to Terms with the Death of the AGW Hypothesis | Watts Up With That?
Pingback: Comments on Stefan Rahmstorf’s Post at RealClimate “What ocean heating reveals about global warming” | Bob Tisdale – Climate Observations
Pingback: Comments on Stefan Rahmstorf’s Post at RealClimate “What ocean heating reveals about global warming” | Watts Up With That?
Pingback: Trenberth and Fasullo Try to Keep the Fantasy Alive | Bob Tisdale – Climate Observations
Pingback: Trenberth and Fasullo Try to Keep the Fantasy Alive | Watts Up With That?
Pingback: If Manmade Greenhouse Gases Are Responsible for the Warming of the Global Oceans… | Bob Tisdale – Climate Observations
Pingback: If Manmade Greenhouse Gases Are Responsible for the Warming of the Global Oceans… | Watts Up With That?
I have just found this article after clicking a few links from WUWT.
Any estimate of the error bars associated with the alleged data?
I estimate that each argo buoy has to sample about 300,000km3 of sea water so I would love to know what the error bars would look like on the above graphs.
Lew Skannen, as far as I know, the errors that the NCDC provides are statistical “standard errors”.
http://www.nodc.noaa.gov/OC5/3M_HEAT_CONTENT/basin_avt_data.html
They do not list measurement errors, uncertainties due to incomplete sampling, etc.
Pingback: On Chylek et al (2014) – The Atlantic Multidecadal Oscillation as a Dominant Factor of Oceanic Influence on Climate | Bob Tisdale – Climate Observations
Pingback: On Chylek et al (2014) – The Atlantic Multidecadal Oscillation as a Dominant Factor of Oceanic Influence on Climate | Watts Up With That?
Pingback: Finally Some Reality from RealClimate – But, Unfortunately, They Remained Unreal about Some Things | Bob Tisdale – Climate Observations
Pingback: Finally Some Reality from RealClimate – But, Unfortunately, They Remained Unreal about Some Things | Watts Up With That?