
We now have 32 years of satellite-enhanced sea surface temperature data, with complete coverage of the global oceans.
MONTHLY SEA SURFACE TEMPERATURE ANOMALY MAP
The following is a Global map of Reynolds OI.v2 Sea Surface Temperature (SST) anomalies for October 2013. It was downloaded from the NOMADS website. The contour levels are set at 0.5 deg C, and white is set at zero.

October 2013 Sea Surface Temperature (SST) Anomalies Map
(Global SST Anomaly = +0.252 deg C)
MONTHLY OVERVIEW
The sea surface temperature anomalies for the NINO3.4 region in the eastern equatorial Pacific (5S-5N, 170E-120E) are a commonly used index for the strength, frequency and duration of El Niño and La Nina events. We keep an eye on the sea surface temperatures there because El Niño and La Niña events are the primary cause of the yearly variations in global sea surface temperatures AND they are the primary cause of the long-term warming of global sea surface temperatures over the past 30 years. See the discussion of the East Pacific versus the Rest-of-the-World that follows.
Monthly NINO3.4 sea surface temperature anomalies are back to being below zero. In the most recent month they cooled about -0.24 deg C. They’re presently at -0.23 deg C. They’re still well within El Niño-Southern Oscillation (ENSO)-neutral conditions, meaning they’re not El Niño or La Niña conditions, where they’ve been cycling for a number of months. Also refer to the discussion of the weekly NINO3.4 data near the bottom of the post. (Also see the discussion of the weekly data toward the end of the post, because it also includes NINO1+2 data.)
Global Sea Surface Temperature anomalies cooled about -0.03 deg C (-0.033 deg C) from September to October, with the Northern Hemisphere showing substantially more cooling. There was basically no change in the surface temperature of the oceans in the Southern Hemisphere. The only ocean basins that warmed in October were the North Atlantic and South Pacific. The monthly Global Sea Surface Temperature anomalies are presently at +0.252 deg C.

(1) Global Sea Surface Temperature Anomalies
Monthly Change = -0.033 deg C
####################################

(2) NINO3.4 Sea Surface Temperature Anomalies
(5S-5N, 170W-120W)
Monthly Change = -0.240 deg C
####################################
THE EAST PACIFIC VERSUS THE REST OF THE WORLD
(Note: I have eliminated the volcano adjustments in the following presentations of East Pacific and Rest of the World sea surface temperature anomalies. The last month with the volcano adjustments was August 2013. See the post here.)
The East Pacific and the Rest-Of-The-World (Atlantic-Indian-West Pacific) datasets were first discussed in the post Sea Surface Temperature Anomalies – East Pacific Versus The Rest Of The World, and were discussed a few months later in How Can Things So Obvious Be Overlooked By The Climate Science Community?
They were also discussed in great detail in my recently published book Who Turned on the Heat? The Unsuspected Global Warming Culprit, El Niño-Southern Oscillation. The Free Preview includes the Table of Contents; the Introduction; the beginning of Section 1, with the cartoon-like illustrations; the discussion About the Cover; and the Closing. Also see the blog post Everything You Every Wanted to Know about El Niño and La Niña… for an overview. The book is only US$8.00. Please click here to buy a copy. (Paypal or Credit/Debit Card. You do not need to open a PayPal account.)
The global oceans were divided into these two subsets to illustrate a couple of facts. First, the linear trend of the East Pacific (90S-90N, 180-80W) Sea Surface Temperature anomalies since the start of the Reynolds OI.v2 dataset is so low it’s basically flat. (Note that the region also includes portions of the Arctic and Southern Oceans.) That is, there has been little to no warming of sea surface temperatures on the East Pacific (from pole to pole) in 32 years. The East Pacific is not a small region. It represents about 33% of the surface area of the global oceans. The East Pacific linear trend varies very slightly with each monthly update. But it won’t vary significantly between El Niño and La Niña events.

(3) East Pacific Sea Surface Temperature (SST) Anomalies
(90S-90N, 180-80W)
####################################
And second are the Sea Surface Temperature anomalies for the Rest of the World (90S-90N, 80W-180). This region includes the Atlantic Indian and West Pacific Oceans, with the corresponding portions of the Arctic and Southern Oceans. Sea surface temperatures there warmed in very clear steps, in response to the significant 1986/87/88 and 1997/98 El Niño/La Niña events. It also appears as though the Sea Surface Temperature anomalies of this dataset October have made another upward shift in response to the 2009/10 El Niño and 2010/11 La Niña events. For those who are interested in the actual trends of the Sea Surface Temperature anomalies between the 1986/87/88 and 1997/98 El Niño events and between the 1997/98 and 2009/10 El Niño events refer to Figure 4 in Does The Sea Surface Temperature Record Support The Hypothesis Of Anthropogenic Global Warming? I further described (at an introductory level) the ENSO-related processes that cause these upward steps in the post ENSO Indices Do Not Represent The Process Of ENSO Or Its Impact On Global Temperature. And as noted above, it is discussed in detail in my recently published book Who Turned on the Heat? The Unsuspected Global Warming Culprit, El Niño-Southern Oscillation.

(4) Sea Surface Temperature Anomalies For The Rest of the World
(90S-90N, 80W-180)
####################################
The periods used for the average Rest-Of-The-World Sea Surface Temperature anomalies between the significant El Niño events of 1982/83, 1986/87/88, 1997/98, and 2009/10 are determined as follows. Using the original NOAA Oceanic Nino Index (ONI) for the official months of those El Niño events, I shifted (lagged) those El Niño periods by six months to accommodate the lag between NINO3.4 SST anomalies and the response of the Rest-Of-The-World Sea Surface Temperature anomalies, then deleted the Rest-Of-The-World data that corresponds to those significant El Niño events. I then averaged the Rest-Of-The-World SST anomalies between those El Niño-related gaps.
The “Nov 2010 to Present” average varies with each update. As noted in the post Sea Surface Temperature Anomalies – East Pacific Versus The Rest Of The World, it will be interesting to see where that Sea Surface Temperature anomaly average settles out, if it does, before the next significant El Niño drives them higher.
Of course, something could shift. Will the upward ratcheting continue when the Atlantic Multidecadal Oscillation (AMO) decides to turn around and start its decline? The upward steps would not continue in the North Atlantic, but would the AMO impact the upward steps in other portions of the globe? For more information about the Atlantic Multidecadal Oscillation, refer to the post An Introduction To ENSO, AMO, and PDO — Part 2.
The Sea Surface Temperature anomalies of the East Pacific Ocean, or approximately 33% of the surface area of the global oceans, have shown little to no long-term warming since 1982 based on the linear trend. And between upward shifts, the Sea Surface Temperature anomalies for the rest of the world (67% of the global ocean surface area) remain relatively flat. As discussed in my book, anthropogenic forcings are said to be responsible for most of the rise in global surface temperatures over this period, but the Sea Surface Temperature anomaly graphs of those two areas prompt a two-part question: Since 1982, what anthropogenic global warming processes would overlook the Sea Surface Temperatures of 33% of the global oceans and have an impact on the other 67% but only during the months of the significant El Niño events of 1986/87/88, 1997/98 and 2009/10?
STANDARD NOTE ABOUT THE DATA
The MONTHLY graphs illustrate raw monthly OI.v2 sea surface temperature anomaly data from November 1981 to October 2013, as it is presented by the NOAA NOMADS website linked at the end of the post. NOAA uses the base years of 1971-2000 for this dataset. I’ve added the 13-month running-average filter to smooth out the seasonal variations.
MONTHLY INDIVIDUAL OCEAN AND HEMISPHERIC SEA SURFACE TEMPERATURE UPDATES

(5) Northern Hemisphere Sea Surface Temperature (SST) Anomalies
Monthly Change = -0.073 deg C
####################################

(6) Southern Hemisphere Sea Surface Temperature (SST) Anomalies
Monthly Change = -0.002 deg C
####################################

(7) North Atlantic Sea Surface Temperature (SST) Anomalies
(0 to 70N, 80W to 0)
Monthly Change = +0.182 deg C
####################################

(8) South Atlantic Sea Surface Temperature (SST) Anomalies
(0 to 60S, 70W to 20E)
Monthly Change = -0.012 deg C
Note: I discussed the (now apparently temporary) upward shift in the South Atlantic Sea Surface Temperature anomalies in the post The 2009/10 Warming Of The South Atlantic. Prior to that shift, the South Atlantic sea surface temperature anomalies had been relatively flat for about two decades. It now looks as though the South Atlantic sea surface temperature anomalies have dropped below the level they were at before that surge.
####################################

(9) Pacific Sea Surface Temperature (SST) Anomalies
(60S to 65N, 120E to 80W)
Monthly Change = -0.080 Deg C
####################################

(10) North Pacific Sea Surface Temperature (SST) Anomalies
(0 to 65N, 100E to 90W)
Monthly Change = -0.243 Deg C
####################################

(11) South Pacific Sea Surface Temperature (SST) Anomalies
(0 to 60S, 120E to 70W)
Monthly Change = +0.016 deg C
####################################

(12) Indian Ocean Sea Surface Temperature (SST) Anomalies
(60S to 30N, 20E to 120E)
Monthly Change = -0.006 deg C
####################################

(13) Arctic Ocean Sea Surface Temperature (SST) Anomalies
(65N to 90N)
Monthly Change = -0.015 deg C
####################################
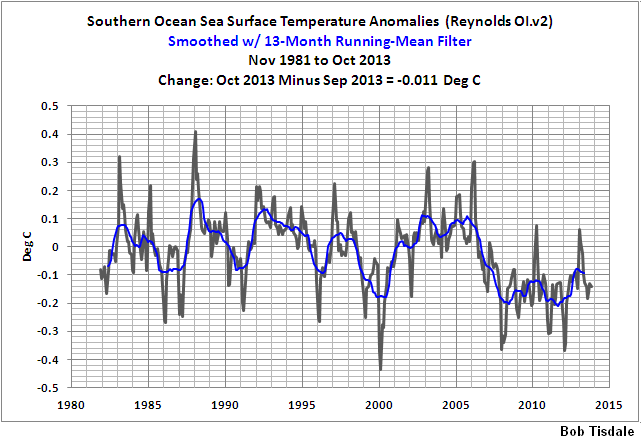
(14) Southern Ocean Sea Surface Temperature (SST) Anomalies
(90S-60S)
Monthly Change = -0.011 deg C
####################################
WEEKLY SEA SURFACE TEMPERATURE ANOMALIES
The NINO3.4 Sea Surface Temperature anomalies based on the week centered on November 6, 2013 are back above zero but well within ENSO-neutral condition. They are presently at +0.08 deg C.

(15) Weekly NINO3.4 Sea Surface Temperature (SST) Anomalies
####################################
Weekly global sea surface temperature anomalies are at +0.251 deg C.

(16) Weekly Global Sea Surface Temperature (SST) Anomalies
####################################
The NINO1+2 region is in the far eastern tropical Pacific. It is bordered by the coordinates of 10S-0, 90W-80W. Weekly sea surface temperature anomalies there are still cool for an ENSO neutral period, but they’ve been slowly edging their way warmer. They are presently at -0.48 deg C.

(17) Weekly NINO1+2 Sea Surface Temperature (SST) Anomalies
####################################
INTERESTED IN LEARNING MORE ABOUT HOW AND WHY THE GLOBAL OCEANS INDICATE THEY’VE WARMED NATURALLY?
Why should you be interested? The hypothesis of manmade global warming depends on manmade greenhouse gases being the cause of the recent warming. But the sea surface temperature record indicates El Niño and La Niña events are responsible for the warming of global sea surface temperature anomalies over the past 32 years, not manmade greenhouse gases. Scroll back up to the discussion of the East Pacific versus the Rest of the World. I’ve searched sea surface temperature records for more than 4 years, and I can find no evidence of an anthropogenic greenhouse gas signal. That is, the warming of the global oceans has been caused by Mother Nature, not anthropogenic greenhouse gases.
I’ve recently published my e-book (pdf) about the phenomena called El Niño and La Niña. It’s titled Who Turned on the Heat? with the subtitle The Unsuspected Global Warming Culprit, El Niño Southern Oscillation. It is intended for persons (with or without technical backgrounds) interested in learning about El Niño and La Niña events and in understanding the natural causes of the warming of our global oceans for the past 30 years. Because land surface air temperatures simply exaggerate the natural warming of the global oceans over annual and multidecadal time periods, the vast majority of the warming taking place on land is natural as well. The book is the product of years of research of the satellite-era sea surface temperature data that’s available to the public via the internet. It presents how the data accounts for its warming—and there are no indications the warming was caused by manmade greenhouse gases. None at all.
Who Turned on the Heat? was introduced in the blog post Everything You Ever Wanted to Know about El Niño and La Niña… …Well Just about Everything. The Free Preview includes the Table of Contents; the Introduction; the beginning of Section 1, with the cartoon-like illustrations; the discussion About the Cover; and the Closing.
Please buy a copy. (Paypal or Credit/Debit Card). You do not need to have a PayPal account. Simply scroll down to the purchase option Simply scroll down to the “Don’t Have a PayPal Account” purchase option. It’s only US$8.00.
NOTE: 30% of my before-tax personal income from the sales of my ebooks (my profits from .pdf edition sales and my royalties from Amazon Kindle edition sales) from November 1, 2013 to December 31, 2013 will be donated to the Philippine Red Cross disaster relief for the victims of Typhoon Haiyan/Yolanda.
SOURCES
The Sea Surface Temperature anomaly data used in this post is available through the NOAA NOMADS website:
http://nomad1.ncep.noaa.gov/cgi-bin/pdisp_sst.sh
or:


Pingback: These items caught my eye – 12 November 2013 | grumpydenier
Pingback: forecast fail … | pindanpost
Pingback: Weekly Climate and Energy News Roundup | Watts Up With That?
Pingback: ‘sponge-ing’ the taxpayer … | pindanpost
Pingback: Cowtan & Way and signs of cooling | Watts Up With That?