
Date: January 31, 2014
Subject: Your Blog Post at SkepticalScience and an Invitation from WattsUpWithThat
From: Bob Tisdale
To: Kevin Trenberth – NCAR
Dear Kevin:
I note that you were co-author of the SkepticalScience blog post Warming oceans consistent with rising sea level & global energy imbalance along with Dana Nuccitelli and Rob Painting. The obvious intent of your post was to convince the SkepticalScience readers that, while the global surface warming (outside of the Arctic) has slowed or stopped since the late 1990s, human-induced global warming continues in the deep oceans. There have been numerous blog posts at SkepticalScience over the past few years that have basically stated the same thing, so, from the sidelines, it appears you’re preaching to the choir.
One would think your time would be better spent trying to convince actual global warming skeptics why we should be concerned about global warming …especially when we consider that in your recent papers you’re acknowledging that natural variability plays a major role in the warming of the surface of the planet. With that in mind, this is an open invitation for you to author a blog post or series of them for WattsUpWithThat (or co-author them with skeptics…like me, for example). There are a number of points you may wish to address and they are discussed in the bulk of this post.
WattsUpWithThat has a much larger internet audience than SkepticalScience. Refer to the recent Alexa statistics here. If you’re not familiar with the Alexa rankings, the lower rankings are better. Point of reference: Google ranks first. Also note the bounce rates and the time visitors spend on both websites. Many more people visit WattsUpWithThat than SkepticalScience and they stay longer at WattsUpWithThat once they’re there. That suggests, of course, if you were to write a post for WattsUpWithThat, more people are likely to read it.
INITIAL COMMENT ON YOUR SKEPTICALSCIENCE POST
Assuming you’re correct and the deep oceans are warming instead of the surface, then your post at SkepticalScience likely appears to many readers to be nothing more than redirection—because it refocuses attention from the problems that climate models are having simulating global surface temperatures. The previous generation (CMIP3) and current generation (CMIP5) climate models cannot explain the current pause in global warming (that’s occurring outside of the Arctic), thus your recent flurry of papers on this topic. Also assuming you’re right, due to the heat capacity of the oceans, the claimed increase in subsurface temperatures of the global oceans (while the halt is taking place at the surface) is so tiny…so minute…so miniscule…that the additional warming of the oceans is not coming back to haunt anyone at any time.
While the topics of ocean heat and energy imbalance have a place in technical discussions, they are of no importance to people and policymakers who want to know how high global surface temperatures might rise in the future and why climate models did not forecast the cessation of global surface warming.
PAST COMMENTS
At WattsUpWithThat, we’ve already discussed many of the arguments you’ve presented…discussed them numerous times. See the posts from my blog (and the cross posts at WUWT in parentheses):
- Trenberth Still Searching for Missing Heat (WUWT cross post here)
- More on Trenberth’s Missing Heat (WUWT cross post here)
- A Different Perspective on Trenberth’s Missing Heat: The Warming of the Global Oceans (0 to 2000 Meters) in Deg C (WUWT cross post here)
- Even More about Trenberth’s Missing Heat – An Eye Opening Comment by Roger Pielke Sr. (WUWT cross post here)
- Open Letter to the Royal Meteorological Society Regarding Dr. Trenberth’s Article “Has Global Warming Stalled?” (WUWT cross post here)
- A Couple of Comments about the Oppenheimer and Trenberth Op-Ed in the Washington Post (WUWT cross post here)
- Meehl et al (2013) Are Also Looking for Trenberth’s Missing Heat (WUWT cross post here)
- Trenberth and Fasullo Try to Keep the Fantasy Alive (WUWT cross post here)
- More on Trenberth and Fasullo (2013) “An Apparent Hiatus in Global Warming?” (WUWT cross post here)
- Comments on the Nature Article “Climate Change: The Case of the Missing Heat” (WUWT cross post here.)
You may want to review those posts, because those are arguments you will face if you choose to author a post for WattsUpWithThat.
POINTS MISSING FROM YOUR ARGUMENT
The core of your recent argument is that there was a turn-of-the-century switch of ENSO mode from a period of El Niño domination to a period when La Niñas dominate. Further to your argument, this change in mode around 1999 has caused the tropical Pacific to release less heat than normal to the atmosphere and to redistribute less warm water from the tropical Pacific to adjoining portions of the oceans. You’ve also argued that the stronger trade winds associated with La Niñas are forcing more warm water to be stored in the western tropical Pacific. As a result, according to your argument, there has been a substantial decline in the warming rate of global surfaces (outside of the Arctic).
This strongly suggests that ENSO was also responsible for an extensive portion of the warming that took place while El Niño events dominated from the mid-1970s to the late-1990s. I don’t recall you ever stating that in so many words in any of the recent papers you’ve written on this topic, and I don’t believe, in light of your new understandings, that you’ve recently attempted to quantify the contribution of ENSO during that late 20th Century warming period.
Based on my research, ENSO—acting as a chaotic, naturally occurring, sunlight-fueled, recharge-discharge oscillator—was in fact responsible for the vast majority of the warming of global sea surface temperatures outside of the North Atlantic during the past 32 years (the satellite era)…and ENSO was also responsible for the vast majority of the warming of the tropical Pacific to depth…and ENSO, along with a shift in sea level pressure (and interdependent wind patterns) of the extratropical North Pacific (as captured by the North Pacific Index that you, Kevin, developed for such purposes) were responsible for most of the long-term warming of the extratropical North Pacific ocean to depths of 700 meters. Add to that the findings of Lozier et al. (2008) The Spatial Pattern and Mechanisms of Heat-Content Change in the North Atlantic. They found that all the warming of the North Atlantic to depth could be explained by natural factors. See the January 2008 article in ScienceDaily titled North Atlantic Warming Tied to Natural Variability about Lozier et al. (2008). The ScienceDaily article includes:
“We suggest that the large-scale, decadal changes…associated with the NAO [North Atlantic Oscillation] are primarily responsible for the ocean heat content changes in the North Atlantic over the past 50 years,” the authors concluded.
Those points were discussed in the posts linked earlier. They should be addressed by you if you elect to prepare a post for WattsUpWithThat.
DATA THAT CONFIRM AND CONTRADICT YOUR ARGUMENT
Based on your argument, the ocean heat content of the western tropical Pacific should be increasing during the hiatus period. In one of your recent papers you argued that the hiatus period started in 1999, with the switch from a positive to a negative Pacific Decadal Oscillation, which you’re using a proxy for ENSO modes. Figure 1 presents the NODC ocean heat content for the western tropical Pacific (24S-24N, 120E-180), for the depths of 0-700 meters, for the period of January 1999 to December 2013. We can see that the western tropical Pacific to depths of 700 meters has, in fact, warmed.

Figure 1
As you’re well aware, the TAO project buoys have sampled subsurface temperatures, etc., in the tropical Pacific since the early 1990s, so the NODC data should be a reasonably reliable there. Over the past decade, ARGO floats have supplemented the TAO buoys. And the source Ocean Heat Content data in the tropical Pacific for 0-700 meters and 0-2000 meters (represented by the unadjusted UKMO EN3 data) during the TAO project and ARGO eras are exactly the same, see Figure 2, and that suggests that all of the variability in the tropical Pacific ocean heat content is taking place in the top 700 meters.

Figure 2
The NODC ocean heat content data also show the ocean heat content (0-700m) of the eastern tropical Pacific, a much larger region, has been cooling from 1999 to 2013. See Figure 3.

Figure 3
As a result, there has been an overall decrease in the ocean heat content of the tropical Pacific since 1999, Figure 4, and a substantial decrease in the ocean heat content of the tropical Pacific as a whole since the peak around 2004.

Figure 4
Therefore, based on data, there appears to have been a rearrangement of heat within the tropical Pacific and not an addition of new heat as your studies suggest.
Also, in the recent post If Manmade Greenhouse Gases Are Responsible for the Warming of the Global Oceans… I presented the NODC’s vertical mean temperature anomaly data for the Indian, Pacific, North Atlantic and South Atlantic Oceans, for the depths of 0-2000 meters, during the ARGO era (starting in 2003). Figure 5 is an update of that illustration, including the recently released 2013 data. The flatness of the Pacific trend indicates there has not been a substantial increase in the subsurface temperatures of the Pacific Ocean as a whole to depths of 2000 meters over the past 11 years…same with the North Atlantic. Manmade greenhouse gases cannot explain the warming in the South Atlantic and Indian Oceans, when they obviously have had no impact on the warming of the North Atlantic and Pacific Oceans to 2000 meters over the past 11 years.
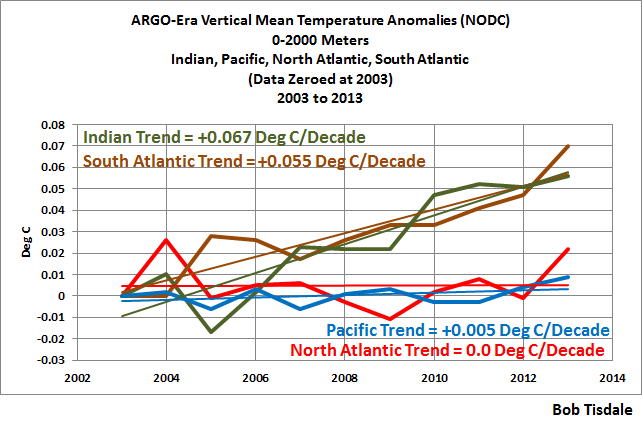
Figure 5
You might argue that the recent warming in the Indian Ocean is a response to ENSO. I would agree. I discussed a number of topics in the post Is Ocean Heat Content All It’s Stacked Up to Be? One of them was the influence of ENSO on the warming of the Indian Ocean to depths of 700 meters. The following is that discussion. Note that I’ve linked the animations and revised the Figure number for this post.
[Start of a portion of “Is Ocean Heat Content All It’s Stacked Up to Be?”]
Why is the Indian Ocean warming during the ARGO era? Figure 6 compares ocean heat content data for the Indian Ocean (90S-90N, 20E-120E) to scaled sea surface temperature anomalies for the NINO3.4 region of the equatorial Pacific. Both datasets have been smoothed with 12-month running average filters. The NINO3.4 data is a commonly used index for the timing, strength and duration of El Niño and La Niña events. The ocean heat content for the Indian Ocean warms in response to El Niño events, but it obviously does not cool proportionally during strong La Niñas.
Why?
It’s simply yet another example of what I’ve been noting for a number of years: La Niñas are not the opposite of El Niños.

Figure 6
In the following animations, you can watch warm water that’s left over from the El Niños being passed from the tropical Pacific into the Indian Ocean during the trailing La Niñas by the current called the Indonesian Throughflow. That leftover warm water counteracts any cooling that would result during the trailing La Niñas due to changes in atmospheric circulation.
ANIMATION 1 presents maps of the NODC ocean heat content data for the ARGO-era, using 12-month averages. The first cells are the average ocean heat content from January to December 2003. These are followed by cells that show the period of February 2003 to January 2004, then March 2003 to February 2004 and so on, until the final cell that captures the average ocean heat content from January to December 2012. The 12-month averages reduce the visual noise and any seasonal component in the data. It’s like smoothing data with a 12-month filter in a time-series graph.
Due to the resolution of the ocean heat content data, you might be having trouble catching the processes that cause the leftover warm water from 2006/07 and 2009/10 El Niños to be carried into the Indian Ocean. ANIMATION 2 is a gif animation of sea level maps for the tropical Pacific from the AVISO altimetry website. The maps also capture the easternmost portion of the tropical Indian Ocean. I’ve started the animation in January 2003 to agree with the discussion of ARGO-era ocean heat content data. So there are a couple of minor El Niños before the 2006/07 El Niño. At the end of the 2006/07 El Niño, a (cool) downwelling Kelvin wave splits the elevated (warm) sea level anomalies along the equator. The residual warm waters are carried west by Rossby waves to Indonesia, and the stronger-than-normal trade winds in the Pacific during the trailing La Niña help to force the residual warm water past Indonesia into the eastern Indian Ocean. In addition to the Indonesian Throughflow, warm water from the southern tropical Pacific also migrates west into the eastern Indian Ocean through the Torres Strait, between Australia and New Guinea. The same thing happens after the 2009/10 El Niño. (My apologies for the shift in the animation in 2011. Aviso changed the format of the maps.)
[End of the portion of “Is Ocean Heat Content All It’s Stacked Up to Be?”]
A COUPLE OF QUICK COMMENTS ON TRENBERTH ET AL. (2014)
Thank you for linking a preprint copy of Trenberth et al. (2014) “Earth’s Energy Imbalance” to your SkepticalScience post. Sorry to say, I haven’t had the opportunity to study it in any detail. But I did take a quick glance. Thank you for including a number of ocean heat content datasets, in addition to the ECMWF ORA-S4. We’ve discussed the problems with that reanalysis in many of the posts listed at the beginning of this one, so I’m not going to dwell on it here…though I note you’re continuing to try to justify using the ORA-S4 reanalysis by showing that it responds to volcanic aerosols where other datasets do not. (Not surprising since the ORA-S4 reanalysis is the output of a computer model that’s forced to cool by volcanic aerosols.)
Also note your Figure 11, which I’ve included as my Figure 7, is missing a La Niña event.

Figure 7
According to the paper you used the old version of the ONI index (base years 1971-2000) as your reference for official El Niño and La Niña events. Clearly, you overlooked the strong 2010/11 La Niña that followed the 2009/10 El Niño. Also, moderate strength La Niña conditions existed during the 2008/09 ENSO season, but they didn’t last long enough to be considered an “official” La Niña based on the old ONI climatology. I’m not sure that helps you for 2008/09 or in 2010/11.
Again, I haven’t had the chance to examine your new paper in much detail. Sorry.
ENSO IS FUELED BY SUNLIGHT, ACCORDING TO YOU, KEVIN
In your much-cited Trenberth et al. (2002) The evolution of ENSO and global atmospheric surface temperatures, you stated:
The negative feedback between SST and surface fluxes can be interpreted as showing the importance of the discharge of heat during El Niño events and of the recharge of heat during La Niña events. Relatively clear skies in the central and eastern tropical Pacific allow solar radiation to enter the ocean, apparently offsetting the below normal SSTs, but the heat is carried away by Ekman drift, ocean currents, and adjustments through ocean Rossby and Kelvin waves, and the heat is stored in the western Pacific tropics. This is not simply a rearrangement of the ocean heat, but also a restoration of heat in the ocean. Similarly, during El Niño the loss of heat into the atmosphere, especially through evaporation, is a discharge of the heat content, and both contribute to the life cycle of ENSO.
Thus my earlier description of ENSO as a chaotic, naturally occurring, sunlight-fueled, recharge-discharge oscillator…with El Niños acting as the discharge phase and La Niñas acting as the recharge phase. But La Niñas also help to redistribute the leftover warm waters from the El Niños—something that was very obvious in the animations linked above.
That quote from 2002 leads to a very basic question: how can you now suggest that the dominance of La Niña events in recent years has caused more greenhouse gas warming of the Pacific to depth, when La Niña events are fueled by sunlight?
To that end, if you should elect to prepare a blog post for us here at WattsUpWithThat, please document the downward shortwave radiation and the downwelling longwave radiation, both at the surface of the tropical Pacific, from the ECMFW ORA-S4 reanalysis, which you rely on so much for your recent papers.
BIG JUMPS
You occasionally describe “big jumps” in global surface temperatures. Your big jumps were discussed in my Open Letter to the Royal Meteorological Society Regarding Dr. Trenberth’s Article “Has Global Warming Stalled?” You have more recently added to those discussions of big jumps. For example, you also referred to the big jumps in your August 2013 interview on NPR (my boldface):
The oceans can at times soak up a lot of heat. Some goes into the deep oceans where it can stay for centuries. But heat absorbed closer to the surface can easily flow back into the air. That happened in 1998, which made it one of the hottest years on record.
Trenberth says since then, the ocean has mostly been back in one of its soaking-up modes.
“They probably can’t go on much for much longer than maybe 20 years, and what happens at the end of these hiatus periods, is suddenly there’s a big jump [in temperature] up to a whole new level and you never go back to that previous level again,” he says.
You can think of it like a staircase. Temperature is flat when a natural cool spell cancels out the gradual temperature increase caused by human activity. But when there’s a natural warm spell on top of the long-term warming trend, the story is dramatically different.
“When the natural variability or when the weather is going in the same direction as global warming, suddenly we’re breaking records, we’re going outside of the bounds of previous experience, and that is when the real damage occurs,” Trenberth says.
First, once again, you’re suggesting that El Niño events caused a portion of the surface warming during the late 20th Century. It had to have been a major portion if a switch to La Niña domination could stop the surface warming. Why not simply come out and state it? Is it because people will then realize that by recognizing that a series of strong El Niños contributed to the warming from the mid-1970s to the late 1990s that you are also recognizing the models have overestimated the future warming? We already understand that…well, most of us do. And people also realize that you also haven’t included the influence of the Atlantic Multidecadal Oscillation, which also contributed to the warming during the late 20th Century. Why not simply state that the models predictions are too high and that they’re probably too high by at least a factor of two?
In the portion of your NPR interview I highlighted above, you suggest that a strong El Niño event can cause a big jump in surface temperatures. We understand that. I first presented those “big jumps” in sea surface temperature more than 5 years ago. And we also agree with you that El Niños are fueled by sunlight…which is part of the “life cycle of ENSO”, as you stated more than a decade ago. But I am very curious about why you seem concerned that “you never go back to that previous level again” after a big jump caused by a strong El Niño. That is precisely what we would expect to happen in a world where natural processes are causing the vast majority of the warming…a world in which the oceans show little influence from the effects of the increased emissions of manmade greenhouse gases.
The 1995/96 La Niña created the warm water for the 1997/98 El Niño via a reduction in cloud cover and an increase in sunlight over the tropical Pacific. The 1997/98 El Niño released that warm water from beneath the surface of the western tropical Pacific…and, in turn, it released a substantial amount of heat into the atmosphere…and an unfathomable volume of warm water was then redistributed around the global oceans in the wake of the 1997/98 El Niño. That leftover warm water prevented global surface temperatures from cooling proportionally during the trailing 1998-01 La Niña. The 1998-01 La Niña also served to replace the warm water in the tropical Pacific that was released and redistributed by the 1997/98 El Niño. Everything fits for a naturally warming world…a world that is not as sensitive to manmade greenhouse gases as simulated by climate models (climate models which still cannot simulate basic ENSO processes).
“THE PAUSE IS FICTIONAL; OCEAN WARMING IS FACTUAL”???
I suspect your co-authors Dana Nuccitelli and Rob Painting wrote that heading for the closing of the SkepticalScience post, Kevin. It’s comical and misleading. Data indicate the oceans are warming to depth, but the warming is not occurring in all ocean basins. Additionally, you, Kevin, wouldn’t have been spending so much of your time over the past few years trying to explain the cessation of global warming outside of the Arctic if the “pause was fictional”.
At the rate the global oceans have warmed to 2000 meters during the ARGO era, Figure 8, no one should really be too concerned about the warming of those oceans, especially when the data suggests it warmed via natural processes.

Figure 8
And no one should be concerned about the observed warming of the oceans to depth when we consider that the warming of the global oceans can cease for almost a decade, according to ORA-S4 reanalysis you continue to present. See my Figure 9, which is an annotated version of the first graph you presented in your blog post.

Figure 9
The following exchange is from the NPR interview linked above:
So will the oceans come to our rescue?
“That’s a good question, and the answer is maybe partly yes, but maybe partly no,” he says.
The oceans can at times soak up a lot of heat. Some goes into the deep oceans where it can stay for centuries. But heat absorbed closer to the surface can easily flow back into the air. That happened in 1998, which made it one of the hottest years on record.
But, again, the warm water for the 1997/98 El Niño was created via a temporary increase in sunlight beating down on the tropical Pacific as part of “the life cycle of ENSO”.
CLOSING
Thank you for considering the possibility of preparing a blog post or series of them for us here at WattsUpWithThat. Many of us applaud you in your efforts to explain the slowdown and cessation of surface warming, but there are many points that need clarification.
Additionally, we really appreciate it when authors of blog posts answer questions posed to them on the thread, so you should expect further exchanges.
Last, if this invitation interests you, please feel free to leave a comment at WattsUpWithThat. If you’d like the initial discussions to be off the record, please leave a comment at my blog Climate Observations where I still moderate comments. We can then discuss the matter further via email.
Sincerely,
Bob Tisdale


Impressive as always Bob. Thank you.
Hi Bob,
great idea! I hope that Kevin Trenberth will agree.
Reblogged this on Climate Ponderings.
Excellent and well done, Bob.
Maybe his missing heat is hidden in the errors in assumptions on the global energy balance. They seem to believe that is a done deal.
Kosada and Xie DID demonstrate that unusually warm temperatures in the Eastern Equatorial Pacific would have enhanced earlier warming. However they buried the key information in the last Table in the supplementary material and discussed it in only one sentence:
“For the recent decade, the decrease in tropical Pacific SST has lowered the global temperature by about 0.15 degC compared to the 1990s (Fig. 1b), opposing the radiative forcing effect and causing the hiatus. Likewise an El-Nino-like trend in the tropics accelerated the global warming from the 1970s to late 1990s (Extended Data Table 1).
As I read Extended Data Table 1:
2002-2012 suppression of warming: -0.20 degC
1971-1997 enhancement of warming: +0.14 degC
Bob, I hope your invitation results in a public dialog with Dr. Trenberth. I don’t like the idea of a “debate” which assumes a confrontational match of wits and a political outcome. I’d prefer that you two identify points of agreement and disagreement and propose avenues for resolving open questions.
Dr. Trenberth rightly may fear abuse from commentors so it would not be a bad thing to heavily moderate and reject those that don’t explicitly address the scientific issues. Please consider this suggestion as a ground rule and not capitulation if it comes down to negotiation of terms with him.
Very well-written and even-handed, as usual, Bob. While I’ve seen nothing that makes me think Trenberth will stray from the alarmist rhetoric that is CAGW dogma, maybe he’ll eventually consider that the first rat to leave a sinking ship is more likely to survive unscathed than the last one is.
As always: clear, instructive, relevant and entirely supported by real data. A flawless chain of logic.
Pingback: Quick Comments on England et al. (2014) | Bob Tisdale – Climate Observations
Pingback: An Odd Mix of Reality and Misinformation from the Climate Science Community on England et al. (2014) | Bob Tisdale – Climate Observations
Pingback: An Odd Mix of Reality and Misinformation from the Climate Science Community on England et al. (2014) | Watts Up With That?
Pingback: Finally Some Reality from RealClimate – But, Unfortunately, They Remained Unreal about Some Things | Bob Tisdale – Climate Observations
Pingback: Finally Some Reality from RealClimate – But, Unfortunately, They Remained Unreal about Some Things | Watts Up With That?
Pingback: March 2016 Update of Global Temperature Responses to 1997/98 and 2015/16 El Niño Events | Bob Tisdale – Climate Observations
Pingback: March 2016 Update of Global Temperature Responses to 1997/98 and 2015/16 El Niño Events | Watts Up With That?
Pingback: March 2016 ENSO Update – We’ll Have to Keep an Eye on the Pocket of Warm Water South of the Equator | Bob Tisdale – Climate Observations
Pingback: March 2016 ENSO Update – We’ll Have to Keep an Eye on the Pocket of Warm Water South of the Equator | Watts Up With That?
Pingback: Global Sea Surface Temperature Responses to the 1997/98 and 2015/16 El Niño Events | Bob Tisdale – Climate Observations
Pingback: Global Sea Surface Temperature Responses to the 1997/98 and 2015/16 El Niño Events | Watts Up With That?
Pingback: Global Sea Surface Temperature Responses to the 1997/98 and 2015/16 El Niño Events – Update 1 | Bob Tisdale – Climate Observations
Pingback: Global Sea Surface Temperature Responses to the 1997/98 and 2015/16 El Niño Events – Update 1 | Watts Up With That?