
Comparisons are still being made of the 1997/98 El Niño with the El Niño forming this year. So I thought we should compare the weekly sea surface temperature anomalies for this year, in two NINO regions, with those during 1997 for the 1997/98 El Niño and 1982 for the 1982/83 El Niño. The 1982/83 and 1997/98 El Niño events were the two strongest single-season events of the late 20th Century. (The 1986/87/88 El Niño wasn’t as strong as the 1982/83 El Niño in terms of peak sea surface temperature anomalies, but the 1986/87/88 event remained an El Niño for more than one year, so it was likely comparable to the 1982/83 El Niño if duration is taken into account.)
First, the NINO3.4 region, see Figure 1. The NINO3.4 region is bordered by the coordinates of 5S-5N, 170W-120W. See the illustration here for the location. It captures the sea surface temperature anomalies of the east-central equatorial Pacific. Sea surface temperature anomalies of the NINO3.4 region are a commonly used index for the strength, timing and duration of El Niño and La Niña events. And as you can see, the weekly NINO3.4 sea surface temperature anomalies still have not reached the +0.5 deg C threshold of El Niño conditions. It’s still a little early. They are presently at +0.31 Deg C compared to the reference years of 1971-2000.
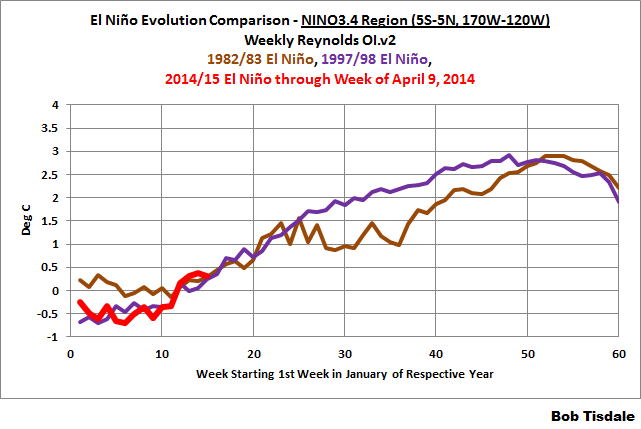
Figure 1
Sea surface temperature anomalies in the NINO3.4 region are evolving about the same as they did for the 1982/83 and 1997/98 El Niños.
– HOWEVER –
Sea surface temperature anomalies of the NINO3.4 region really don’t do justice to the 1997/98 El Niño. That El Niño was freakish in how quickly it evolved in the eastern (not central) equatorial Pacific and how warm the sea surface temperatures eventually grew there. We can use the sea surface temperature anomalies of the NINO1+2 region to illustrate this. See Figure 2. The NINO1+2 region is bordered by the coordinates of 10S-0, 90W-80W. It’s just west east and south of the Galapagos Islands.

Figure 2
The sea surface temperature anomalies in the eastern equatorial Pacific are evolving this year more like the 1982/83 El Niño. The NINO1+2 data for 1997 shows east Pacific sea surface temperatures warmed much sooner during the 1997/98 El Niño.
The 1982/83 El Niño was strong, there’s no doubt about that, but it was nowhere close to being comparable to the 1997/98 El Niño as an east Pacific event.
A couple of things to keep in mind: First, there are subtle differences between El Niño events. It’s still very early in the evolution this year to make predictions of how strong the 2014/15 El Niño will eventually become.
Second, before you look at global surface temperature data and conclude that the 1982/83 El Niño had a very small effect on global surface temperatures, compared to the 1997/98 El Niño, keep in mind that the 1982/83 El Niño was counteracted by the eruption of El Chichon that year and there was no colossal explosive volcano in 1997 to offset the 1997/98 El Nino.
EARLIER POSTS IN THIS SERIES
- The 2014/15 El Niño – Part 1 – The Initial Processes of the El Niño.
- The 2014/15 El Niño – Part 2 – The Alarmist Misinformation (BS) Begins
FURTHER READING
My ebook Who Turned on the Heat? goes into much more detail to explain El Niño and La Niña processes and the long-term aftereffects of strong El Niño events. I’ve lowered the price of Who Turned on the Heat? from U.S.$8.00 to U.S.$5.00…with hope of increasing sales a little bit. A free preview in pdf format is here. The preview includes the Table of Contents, the Introduction, the first half of section 1 (which was provided complete in the post here), a discussion of the cover, and the Closing. Take a run through the Table of Contents. It is a very-detailed and well-illustrated book—using data from the real world, not models of a virtual world. Who Turned on the Heat? is only available in pdf format…and will only be available in that format. Click here to purchase a copy. Thanks.


Thanks for the perspective Bob.
Oops, I forgot to include the data source:
The Sea Surface Temperature anomaly data used in this post is available through the NOAA NOMADS website:
http://nomad1.ncep.noaa.gov/cgi-bin/pdisp_sst.sh
or:
http://nomad3.ncep.noaa.gov/cgi-bin/pdisp_sst.sh?lite=
Bob, I mentioned to you some years back the deep interest that those of us in the grain market research business have in your stuff concerning ENSO, but not concerning its connections with land/ocean temp anomalies so much as with the various intercontinental “teleconnections” claimed by NOAA for ENSO, and our own efforts to make correlations with grain yield changes in the major regions of interest—the US cornbelt, Ukraine, Argentina, and Brazil. I am certain that if you added this focus, you would become exposed to a larger group of researchers who can pay for things, as opposed only to those with an anti-AGW hobby. You might want to look at Roy Spencer’s blog of March 18, 2014, which mentions my company and uses one of my charts. If you want to examine this further, please contact me by direct email, and I will reply with sample reports. Your current analysis that the emerging 2014 El Nino is more like 82-83 than 97-98 is of keen interest.
Bill
Bill Hudson, thanks for the idea. Right now my plate is full, but I’ll take a look and see if I can be of value.
Regards
More great insight.
Pingback: The 2014/15 El Niño – Part 4 – Early Evolution – Comparison with Other Satellite-Era El Niños | Bob Tisdale – Climate Observations
No way to compare events. Yet, this multi part article seems to keep comparing events to let everyone know its not like the 97/98 and its more like 82/83 (comparison). There’s not enough historical data to make comparisons of any sort on El Nino events except for the timing of the development and the wind anomalies associated with development. Actual ocean reactions are not able to be accurately forecasted yet. Let those other articles be. Focus on what you know.
FYI in 97′ there was a large area of cool surface water west of the 1+2 region that doesn’t exist with this event. Fact is that everything is setup. now we need one more significant wwb to cause development we saw in 97′. There is plenty of time for this to grow into a monster possibly and we are seeing some reversal in trade winds at the moment over the Western Pacific. If you look back at the link below and notice the development between now and mid-May it was explosive. If that was to start in even July we would see an usually strong El Nino. We’re in the most interesting time of this event and I look forward to future post.
http://www.ospo.noaa.gov/Products/ocean/sst/anomaly/1997.html
Weather Bob says: “No way to compare events. Yet, this multi part article seems to keep comparing events to let everyone know its not like the 97/98 and its more like 82/83 (comparison).”
I agree that there’s no way to compare events. And sorry if I gave the wrong impression. It’s not my intent to let anyone believe that the upcoming event will be more like the 1982/83 E Nino than the 1997/98 El Nino. I present data. I don’t make predictions.
Weather Bob says: “FYI in 97′ there was a large area of cool surface water west of the 1+2 region that doesn’t exist with this event.”
The data disagree with you. Sea surface temperature anomalies for the NINO3 region (just west of the NINO1+2 region) this year dropped down temporarily below the 1997 values.
And yes, it will be interesting to watch this develop.
Regards
Pingback: The 2014/15 El Niño – Part 4 – Early Evolution – Comparison with Other Satellite-Era El Niños | Watts Up With That?
Pingback: The 2014/15 El Niño – Part 5 – The Relationship Between the PDO and ENSO | Bob Tisdale – Climate Observations
Pingback: The 2014/15 El Niño – Part 5 – The Relationship Between the PDO and ENSO | Watts Up With That?
Bob,
I have just ’discovered’ your blog recently, but I like the clarity of your conceptual models for El Niño and La Niña. Your commitment to remain evidence driven is also very commendable.
What can be said about the currently developing El Niño on the basis of the preceding Niñas? What do we know about heat stored in that preceding phase with all the ARGO infrastructure?
Thanks.
Hi, Hugo, Welcome aboard.
The ARGO floats are helpful for the tropical Pacific, but they’ve only been in place for a decade. Luckily, the TAO Project floats have been fully in place in the equatorial Pacific since the early 1990s.
The two sets of double-dip La Ninas before and after the 2009/10 El Nino did not have a drastic impact on the ocean heat content of the tropical Pacific. (Not all La Ninas have the same effect apparently):

The La Ninas that trailed the 2009/10 El Nino replaced some of the heat released by that El Nino, but not all of it.
The graph is from the post here:
Regards
Pingback: The 2014/15 El Niño – Part 6 – What’s All The Hubbub About?… | Bob Tisdale – Climate Observations
Pingback: The 2014/15 El Niño – Part 6 – What’s All The Hubbub About?… | Watts Up With That?
Pingback: The 2014/15 El Niño – Part 7 – May 2014 Update and What Should Happen Next | Bob Tisdale – Climate Observations
Pingback: The 2014/15 El Niño – Part 7 – May 2014 Update and What Should Happen Next | Watts Up With That?
Pingback: The 2014/15 El Niño – Part 8 – The Southern Oscillation Indices | Bob Tisdale – Climate Observations
Pingback: The 2014/15 El Niño – Part 8 – The Southern Oscillation Indices | Watts Up With That?
Pingback: The 2014/15 El Niño – Part 9 – Kevin Trenberth is Looking Forward to Another “Big Jump” | Bob Tisdale – Climate Observations
Pingback: The 2014/15 El Niño – Part 9 – Kevin Trenberth is Looking Forward to Another “Big Jump” | Watts Up With That?
Pingback: The 2014/15 El Niño – Part 10 – June 2014 Update – Still Waiting for the Feedbacks | Bob Tisdale – Climate Observations
Pingback: The 2014/15 El Niño – Part 10 – June 2014 Update – Still Waiting for the Feedbacks | Watts Up With That?
Pingback: The 2014/15 El Niño – Part 11 – Is the El Niño Dying? | Bob Tisdale – Climate Observations
Pingback: The 2014/15 El Niño – Part 11 – Is the El Niño Dying? | Watts Up With That?
Pingback: The 2014/15 El Niño – Part 12 – July 2014 Update – The Feedbacks Need to Kick in Soon | Bob Tisdale – Climate Observations
Pingback: The 2014/15 El Niño – Part 12 – July 2014 Update – The Feedbacks Need to Kick in Soon | Watts Up With That?
Pingback: The 2014/15 El Niño – Part 13 – More Mixed Signals | Bob Tisdale – Climate Observations
Pingback: The 2014/15 El Niño – Part 13 – More Mixed Signals | Watts Up With That?
Pingback: The 2014/15 El Niño – Part 14 – Warm Water Recirculated? | Bob Tisdale – Climate Observations
Pingback: The 2014/15 El Niño – Part 14 – Warm Water Recirculated? | Watts Up With That?
Pingback: The 2014/15 El Niño – Part 15 – August 2014 Update – An El Niño Mulligan? | Bob Tisdale – Climate Observations
Pingback: The 2014/15 El Niño – Part 15 – August 2014 Update – An El Niño Mulligan? | Watts Up With That?
Pingback: The 2014 15 El Niño – Part 15 – September 2014 Update – Still Seeing Mixed Signals | Bob Tisdale – Climate Observations
Pingback: The 2014 15 El Niño – Part 15 – September 2014 Update – Still Seeing Mixed Signals | Watts Up With That?
Pingback: The 2014/15 El Niño – Part 18 – October 2014 Update – One Last Chance? | Bob Tisdale – Climate Observations
Pingback: The 2014/15 El Niño – Part 18 – October 2014 Update – One Last Chance? | Watts Up With That?
Pingback: The 2014 15 El Niño – Part 19 – Is an El Niño Already Taking Place? | Bob Tisdale – Climate Observations
Pingback: The 2014/15 El Niño – Part 19 – Is an El Niño Already Taking Place? | Watts Up With That?
Pingback: The 2014/15 El Niño – November Update – The Little El Niño That Shoulda’-Woulda’-Coulda’ | Bob Tisdale – Climate Observations
Pingback: The 2014/15 El Niño – Part 20 – November Update – The Little El Niño That Shoulda’-Woulda’-Coulda’ | Watts Up With That?