
*Based on the Linear Trend
A new study funded by the US Geological Survey (USGS) was introduced with the USGS press release Ocean Warming Affecting Florida Reefs – Increased Temperatures Spell Trouble for Corals. The press release was included in yesterday’s post Claim: Ocean Warming Affecting Florida Reefs at WattsUpWithThat. The study compares sea surface temperatures from a century ago to recent values, see Figure 1, as measured at lighthouses in the Florida Keys, but it fails to illustrate or discuss that temperatures reached similar levels during the mid-20th Century…or the fact that sea surface temperatures for that part of the Florida Keys show no warming in 80+ years.
The paper being discussed is Kuffner et al. (2014) A Century of Ocean Warming on Florida Keys Coral Reefs: Historic In Situ Observations. My Figure 1 is their Figure 2. It shows the sea surface temperatures measured at two lighthouses in the Florida Keys during two periods: recent multidecadal periods and multidecadal periods about a century ago. There’s obviously some missing data…a lot of missing data.
Hmmm. That’s odd. Why would they fail to illustrate most of the data? Could they simply have cherry-picked two time periods—per lighthouse—so they could make alarmist claims about coral reefs? Notice how there are different periods shown for the two lighthouses. Odd.
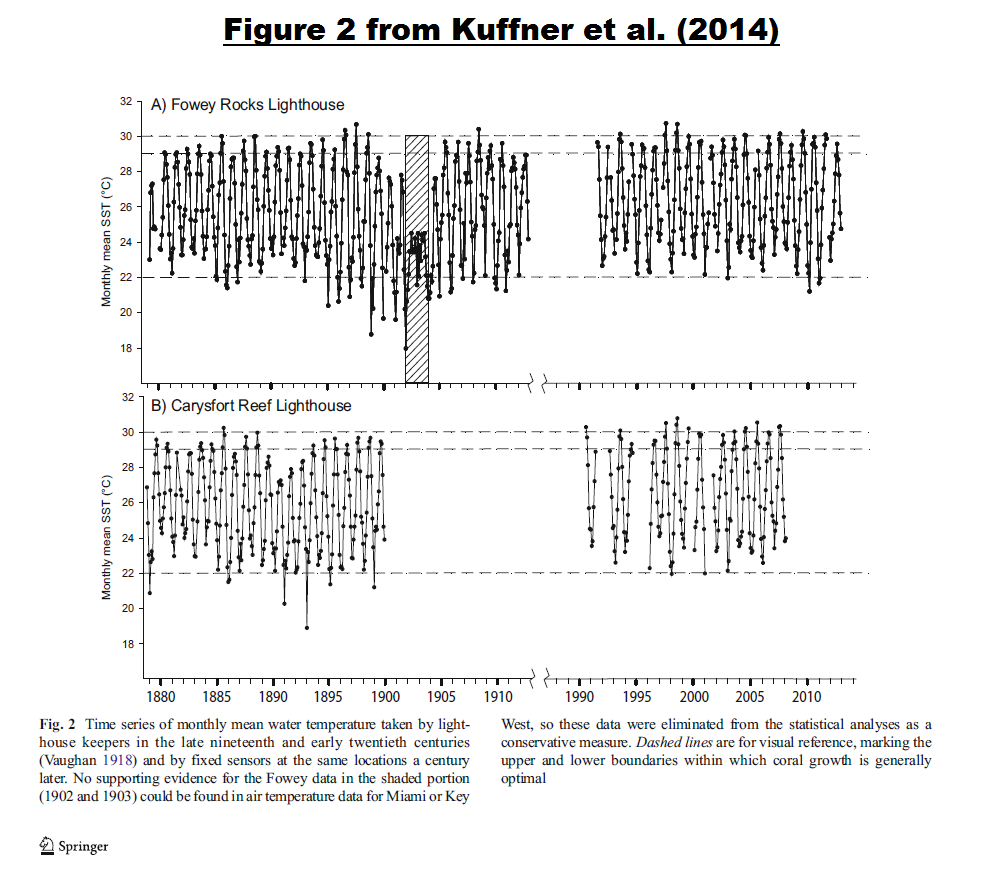
Figure 1
The warming period in the early 20th Century is missing…and so is the mid-20th Century cooling period…and so is much of the warming period in the late 20th Century.
To confirm our suspicions, let’s see what the sea surface temperature data from one of the normal sources have to say.
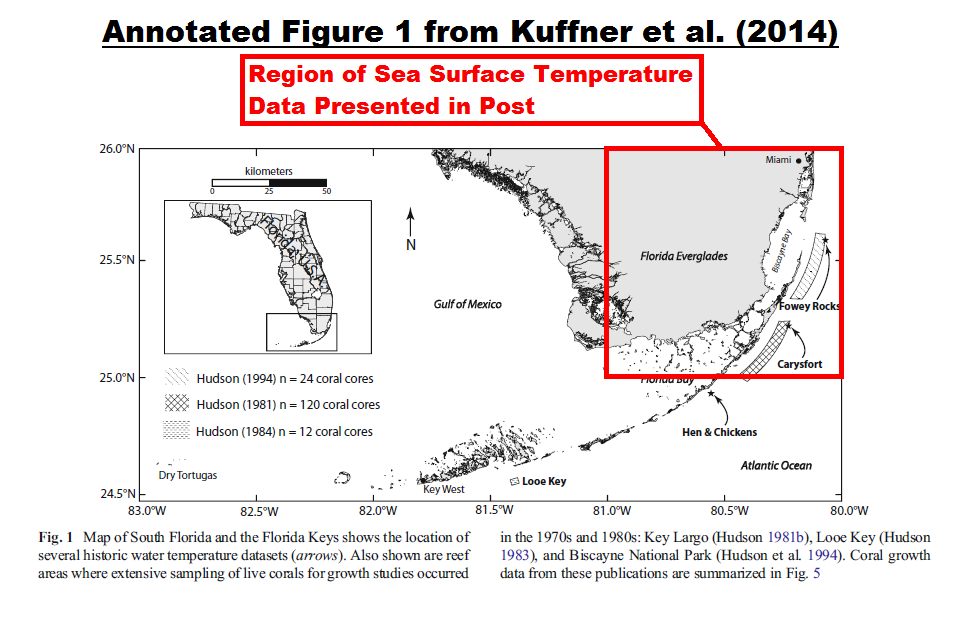
As we can see in the map here (Figure 1 from Kuffner et al. (2014)), those two lighthouses in the Florida Keys aren’t too far apart. NOAA’s ERSST.v3b data and the UKMO’s HADSST3 data are presented in 5-degree longitude by 5-degree latitude grids. Those are way too large for our purposes. That leaves us with the UKMO HADISST data, which are presented in 1-degree longitude by 1-degree latitude grids. In the map linked above, I’ve highlighted the coordinates of 25N-26N, 81W-80W. That’s the teeny-tiny region we’re looking at in this post. And we’ll call that teeny-tiny region the Northeast Florida Keys.
Feel free to choose one of the other sea surface temperature datasets and/or expand the grid size. The results are not going to be too different from what follows.
Let’s start with anomalies. Figure 2 illustrates the HADISST-based sea surface temperature anomalies for the Northeast Florida Keys (25N-26N, 81W-80W). There appears to be a multidecadal signal in the data. The sea surface temperatures there appear to have cooled from the 1880s to the early 20th Century, then warmed until the 1940s. Thereafter, they cooled until about 1980 and then warmed to early 2000s. In recent years, there were a number of very cool months in the Northeast Florida Keys.
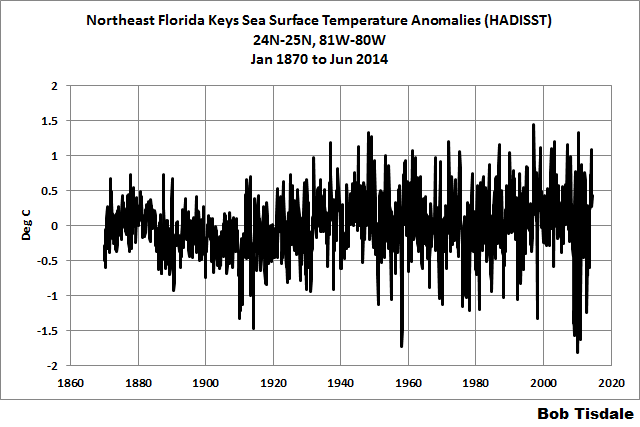
Figure 2
I’ve smoothed the data with a 121-month running-mean filter (centered) in Figure 3 to help confirm those multidecadal variations. Oddly, Kuffner et al. (2014) didn’t bother to mention that it seems as though the sea surface temperatures of the Northeast Florida Keys may have already begun another multidecadal cooling period.

Figure 3
Let’s see how many decades we can go back in time and still not show any warming there. Based on the linear trend, the data for the Northeast Florida Keys reveal the sea surface temperature anomalies show no long-term warming or cooling in more than 8 decades. See Figure 4.

Figure 4
Yet, somehow, we’re supposed to believe manmade greenhouse gases are causing harm to the coral in recent years.
Further to this, Kuffner et al. (2014) focused on August, which is the warmest month of the annual cycle in sea surface temperatures for the Northeast Florida Keys. And they listed sea surface temperatures (thresholds) that were stressful (29 deg C) and very stressful (30 deg C) to the corals. Curiously, the Kuffner et al. (2014) Figure 2 (my Figure 1) shows that sea surface temperatures are above the 29 deg C stress threshold nearly every year, even back in the late 1800s. It even showed that there were occasional excursions above the 30 deg C very-stressful threshold in the early data.
My Figure 5 presents the HADISST-based August sea surface temperatures for the Northeast Florida Keys. It confirms that coral have had to deal with sea surface temperatures that are said to be stressful almost each and every year, and that sea surface temperatures regularly reached and exceeded levels that are said to be very stressful in the 1940s, 50s and 60s…and, if the early data are believable, on occasion, they were above very stressful levels in the late 1800s and early 1900s.

Figure 5
Why do I have the funny feeling that, in the not too distant future, Secretary of State Kerry and President Obama will be claiming manmade global warming hurts baby corals in the Florida Keys?
SOURCE
Data presented in this post are available through the KNMI Climate Explorer.


Bob, as usual, a thorough and clear presentation of readily available data. I urge you to send a link to the authors and ask why they didn’t do this? Are they simply unaware or is it something else?
Thanks Bob, another clear demonstration of climate fallacy.
Thanks, Bob. A very clear presentation of your powerful rebuttal of Kuffner et al. (2014).
I live very near to the Fowey Rocks site and watch the NWS-NOAA temperatures at http://www.ssd.noaa.gov/goes/east/wfo/mfl/flash-rb.html
The readings seem to be consistently too high but normal in their local climatology.
Same thing appears to happen with the air temperatures; it feels colder than the figures from the NWS-NOAA, WeatherBug and Intellicast. My personal thermometer agrees with my feelings, not the published figures.
Maybe it is too well shaded and protected from the wind?
Thanks Bob.
If I assume these authors went looking for a problem then it is not so “odd” that they found one and reported it using only the data that supported it. The term “confirmation bias” comes up a lot these days and this seems a perfect example. This is closely related to the behavior Richard Feynman spoke against: “The first principle is that you must not fool yourself — and you are the easiest person to fool”.
In the caption of their Figure 2: “upper and lower boundaries within which coral growth is generally optimal” —
How many times in the last 3 M years have conditions for coral, or anything else, not been optimal? Corals have managed to muddle through.
Yes, John. It is “confirmation bias”, to put it mildly, but is is scientific fraud if you see it from an ancient point of view.
Off topic…
“In short, if you are someone who wants more or stronger ENSO events in the future, I have great news for you–research supports that. If you are someone who wants fewer or weaker ENSO events in the future, don’t worry–research supports that too.”
http://www.climate.gov/news-features/blogs/enso/enso-climate-change-headache
Is it just me, or does it seem like we often spend too much time with our fancy statistical analyses, when sometimes all it takes are the simple stats like you’ve done here? Everyone wants to use a fancy filter or anomalous detection (which requires a potentially biases calibration) to show how they’ve found some deep hidden secret in the data. Don’t get me wrong. They’re fine tools and they have their place, but in the quest to get published, secure position, gain notoriety, things get a little overdone and the “Keep It Simple Stupid” gets lost.
A simple average, a simple mean, a simple threshold, maybe a standard deviation. These big picture tools still seem the most useful and yet the most forgotten. Everyone wants to dive into their latest notch filter or other fancy tool that shows something “funny” in the data, that may or may not really exist there, given the cleanliness of the data – or it may just be a funny result of the maths.
Thanks for putting the data back into perspective, with simple tools.
Alec, aka daffy duck, thanks for the link. They overlooked another problem. The climate models used for prediction of future climate (the models in the CMIP5 archive) cannot simulate basic ENSO processes. I think I’ll leave Tom Di Liberto a comment to that effect. Let’s see if it passes moderation. That usually takes a day or so.
Alec, aka daffy duck, FYI, the NOAA ENSO blog posted the comment:
http://www.climate.gov/comment/274#comment-274
Cheers
Bob, have you sent this to the journal?
Bob, nope.
Cheers.
hi, bob tisdle. i am new to the climate debate. i have been reading your series of articles at wattsupwiththat about el nino. thank you. they were very educational. there were lots of other articles about el nino this year, and yours were easiest to understand.
i am skeptical of skeptics so i habve been lurking at hotwhopper too. i checked a few things about her recent article (the one about this post) and found she was wrong. i tried to point those things out to her. she responded by calling me a troll and saying i needed to go back to primary school. wow. what a bitch. outta there. i’ve now deleted hotwhopper from my favorites.
i think you’ll be interested in my notes about her article. i hope this link works.
http://blog.hotwhopper.com/2014/09/perennially-puzzled-bob-tisdale-surfs.html?showComment=1410536036510#c1825756406718567549
i also expect her to delete my comment so i tried to use the archive sou uses.
https://archive.today/ahHWC
sincerely
7DaBrooklynKnight7
7DaBrooklynKnight7, welcome. Thank you much for the kind words about the El Nino series.
And thank you for the links to your comments at HotWhopper. I suspected that the sea surface temperature data from the buoys would match the HADISST data. I’m glad you took the time to confirm it for the Augusts. Those buoys as you noted in your last comment at HotWhopper should be part of the ICOADS source data, which is then used in HADISST.
Gotta go. Gonna be late for work.
Cheers.
7DaBrooklynKnight7, PS: You were also right about something else. Sou deleted your final comment there. Thanks for archiving it. I’ll try to do a post about this tonight or tomorrow morning.
Regards
Pingback: Open Letter to Miriam O’Brien of HotWhopper (a.k.a. Sou) | Bob Tisdale – Climate Observations
Pingback: Open Letter to Miriam O’Brien of HotWhopper (a.k.a. Sou) | Watts Up With That?
Hi Miriam. I suspect you’ll stop by this thread to confirm that 7DaBrooklynKnight7 did in fact (1) leave a comment here and (2) did archive your post before you deleted his comment.
I still haven’t gotten around to rebutting your comments on this post. 7DaBrooklynKnight7 was accurate, though.
Have a nice day!
Pingback: More On Miriam O’Brien’s Misunderstandings at HotWhopper | Bob Tisdale – Climate Observations
Pingback: More On Miriam O’Brien’s Misunderstandings at HotWhopper | Watts Up With That?