
Preliminary Note: An “alarmism warning” indicates alarmism is imminent. On the other hand, an “alarmism watch” indicates alarmism might occur, but that’s all the time.
We’re not just talking a record high for the month of August…we’re talking a record high for any month during the satellite era. I suspect our alarmist friends will be making all sorts of claims about attribution even though climate models still almost double the observed rate of ocean surface warming during the satellite era.
We recently discussed the likely reasons for the record high sea surface temperatures in the North Pacific, and their impacts on global sea surface temperatures. See the post On The Recent Record-High Global Sea Surface Temperatures – The Wheres and Whys. According to the preliminary satellite-enhanced sea surface temperature data for August 2014, the sea surfaces of the North Pacific are still warming. See Figure 1. After almost 2 ½ decades of showing no warming, apparently a blocking high is driving sea surface temperatures in the North Pacific skyward.

Figure 1
Due to the enormity of the North Pacific, and due to the magnitude of its apparent upward shift, sea surface temperatures globally are at record high levels, as shown in Figure 2. And as noted above, the record is not just for the month of August, we’re talking record highs for any month.
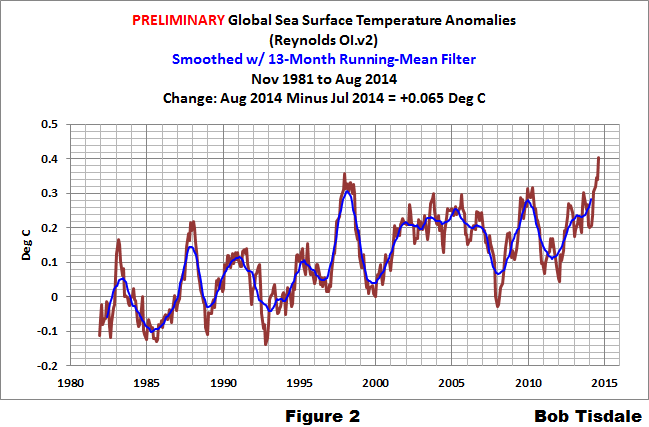
Figure 2
AND NOW BACK TO YOUR REGULARLY SCHEDULED PRELIMINARY SEA SURFACE TEMPERATURE UPDATE FOR AUGUST 2014
GENERAL NOTES – BOILERPLATE
The August 2014 Reynolds OI.v2 Sea Surface Temperature (SST) data through the NOAA NOMADS website won’t be official until Monday, September 8,, 2014. Refer to the schedule on the NOAA Optimum Interpolation Sea Surface Temperature Analysis Frequently Asked Questions webpage. This post includes the preliminary Global and NINO3.4 sea surface temperature anomalies for August 2014 that the NOMADS website prepares based on incomplete data for the month. I’ve also included the weekly data through the week centered on August 27, 2014. The base years for anomalies are 1971-2000, which are the standard base years from the NOAA NOMADS website for this dataset.
PRELIMINARY MONTHLY DATA
The preliminary global sea surface temperature anomalies for August are presently at about +0.40 deg C. See Figure 2 above. Based on the preliminary data, they warmed a good amount (an increase of about +0.065 deg C) since July. With the apparent upward shift in the North Pacific sea surface temperature anomalies last year, and the early El Niño conditions this year, we’re looking at the possibility of record-high global sea surface temperatures for the year 2014. The other factor, of course, is the upward shift in the sea surface temperatures of the South Atlantic-Indian-West Pacific subset in response to the 1997/98 El Niño. See the discussion in this post under the heading of The East Pacific Versus the Rest of the World and the post here.
Another consideration, the sea surface temperatures in the equatorial Pacific are warming again, in response to another downwelling (warm) Kelvin wave.
The sea surface temperature anomalies of the NINO3.4 region in the eastern equatorial Pacific (5S-5N, 170W-120W) are a commonly used index for the strength, frequency, and duration of El Niño and La Niña events. See the illustration here for the location of the NINO3.4 region. Based on the preliminary data, August 2014 NINO3.4 sea surface temperature anomalies are now slightly below the +0.5 deg C threshold of an El Niño event. They’re presently at +0.32 deg C. The threshold for El Niño conditions is considered to be warmer than or equal to +0.5 deg C (and for a La Niña, it’s cooler than or equal to -0.5 deg C). So the reading of +0.32 indicates the tropical Pacific in in ENSO-neutral conditions based on the preliminary monthly data. Also refer to the weekly data that follows, because the weekly NINO3.4 data have shown warming again in recent weeks.

Figure 3
######################
WEEKLY DATA
Weekly NINO3.4 region (5S-5N, 170W-120W) sea surface temperature anomalies for the week centered on August 27, 2014 have recently warmed and they are once again approaching the threshold of El Niño conditions. The weekly NINO3.4 sea surface temperature anomalies are approximately +0.47 deg C.

Figure 4
######################
The weekly Global sea surface temperature anomalies are now at record high levels. They are presently about +0.45 deg C.

Figure 5
######################
INTERESTED IN LEARNING MORE ABOUT THE EL NIÑO AND LA NIÑA AND THEIR LONG-TERM EFFECTS ON GLOBAL SEA SURFACE TEMPERATURES?
Why should you be interested? Sea surface temperature records indicate El Niño and La Niña events are responsible for the warming of global sea surface temperature anomalies over the past 30 years, not manmade greenhouse gases. I’ve searched sea surface temperature records for more than 4 years and ocean heat content records for more than 3 years, and I can find no evidence of an anthropogenic greenhouse gas signal in either dataset. That is, the warming of the global oceans has been caused by naturally occurring, sunlight-fueled, coupled ocean-atmosphere processes, not anthropogenic greenhouse gases.
Last year I published an ebook (pdf) about the phenomena called El Niño and La Niña. It’s titled Who Turned on the Heat? with the subtitle The Unsuspected Global Warming Culprit, El Niño Southern Oscillation. It is intended for persons (with or without technical backgrounds) interested in learning about El Niño and La Niña events and in understanding the natural causes of the warming of our global oceans for the past 31+ years. Because land surface air temperatures simply exaggerate the natural warming of the global oceans over annual and multidecadal time periods, the vast majority of the warming taking place on land is natural as well. The book is the product of years of research of the satellite-era sea surface temperature data that’s available to the public via the internet. It presents how the data accounts for its warming—and there are no indications the warming was caused by manmade greenhouse gases. None at all.
Who Turned on the Heat? was introduced in the blog post Everything You Ever Wanted to Know about El Niño and La Niña… …Well Just about Everything. The Free Preview includes the Table of Contents; the Introduction; the beginning of Section 1, with the cartoon-like illustrations; the discussion About the Cover; and the Closing.
Please buy a copy. (Credit/Debit Card through PayPal. You do NOT have to open a PayPal account. Simply scroll down to the “Don’t Have a PayPal Account” purchase option. It’s only US$8.00 marked down to U.S.$5.00.
SOURCE
The Sea Surface Temperature anomaly data used in this post is available through the NOAA NOMADS website:
http://nomad1.ncep.noaa.gov/cgi-bin/pdisp_sst.sh


I see nothing alarming about this in terms of the natural course of events. It appears to be entirely related to the eventual migration of tropical sun-warmed waters towards the northern latitudes, where it evaporates away. It can take a longer or less longer time to do that depending on atmospheric conditions. If it is alarming, it would only be alarming to people who are not used to or prepared for snow. Lots of snow. Under the current scenario, if sufficient evaporation is allowed, I expect tons of snow and rain (sorry California) to inundate the northern latitudes this winter, especially if we get an Arctic vortex/jet stream loop that turns all that evaporating moisture into snowmageddon.
However, Bob is right. The alarmists will come out in droves, blaming all that northern Pacific ocean heat and eventual snow on global warming. Children won’t know what blah blah blah is.
Exactly — we don’t need to worry about rising SSTs because they will just “evaporate away.” And who can be alarmed by “tropical sun-warmed waters” (how relaxing!). Finally, all that snow and rain will surely convince people that global warming is a hoax.
Bob you may be interested in this. It is a report that was published online 18 January 2014.
Ice cores from Mt Logan show an abrupt Climate Change ca 4.2 ka BP. Greenland and Canadian Arctic ice-core ä18O records show no obvious equivalent to this feature.
“In northwestern North America, the 4.2 ka BP event was tentatively identified in proxies such as marine sediments (Chang and Patterson, 2005; Dallimore et al., 2005), lake sediments (Clegg et al., 2010), and peat accumulation or inception records (Yu et al., 2003; Gorham et al., 2007), as well as by a widespread advance of mountain glaciers at the time (Menounos et al., 2008). Fisher (2011), building on a theoretical framework developed by Sun (2000), suggests that the δ18O shift at ~4.2 b.p. recorded in the Mt. Logan PRC core may have signaled the initiation of the modern ENSO regime. Barron and Anderson (2011) present a somewhat similar scenario based on a variety of paleoclimatic evidence from the North Pacific. Fisher (2011) postulates that the transition to the modern ENSO regime occurred when tropical Pacific deep waters had sufficiently cooled relative to surface waters to establish the temperature differential needed to start the quasi-periodic oscillation in the ocean-atmosphere system that we now identify with ENSO.”
Ice Cores from the St. Elias Mountains, Yukon, Canada: Their Significance for Climate, Atmospheric Composition and Volcanism in the North Pacific Region
Click to access Arctic-KLRS-79199.pdf
Thanks, Bob. It is always good to look at data, even when only preliminary.
And, with the already upon us new IPECAC Assessment, yes sound the alarmism alarm!
NEWS TIP:
Gulf of Maine: ‘Poster child’ for global warming
Sep 03, 2014 By PATRICK WHITTLE Associated Press
FRIENDSHIP, Maine (AP) – Scientists say the Gulf of Maine is warming
faster than more than 99 percent of the world’s oceans…
http://www.wcax.com/story/26432903/gulf-of-maine-poster-child-for-global-warming
hmmm, no mention of AMO.
FYI: Gulf of Maine was actually a lot COOLER in July 2014 compared to July 2013:
July 2013

July 2014

Link to site: http://wavy.umeoce.maine.edu/frames_anoms.html
Pingback: Baseless Alarmism: Global Warming’s Impact on Gulf of Maine Driving Away Lobsters and Fish | Bob Tisdale – Climate Observations
Pingback: Baseless Alarmism: Global Warming’s Impact on Gulf of Maine Driving Away Lobsters and Fish | Watts Up With That?