
During the hurricane season, I’ll be adding the sea surface temperatures and anomalies of the Main Development Region of hurricane development in the North Atlantic to the Monthly Sea Surface Temperature Updates. This post will serve as a reference.
OVERVIEW
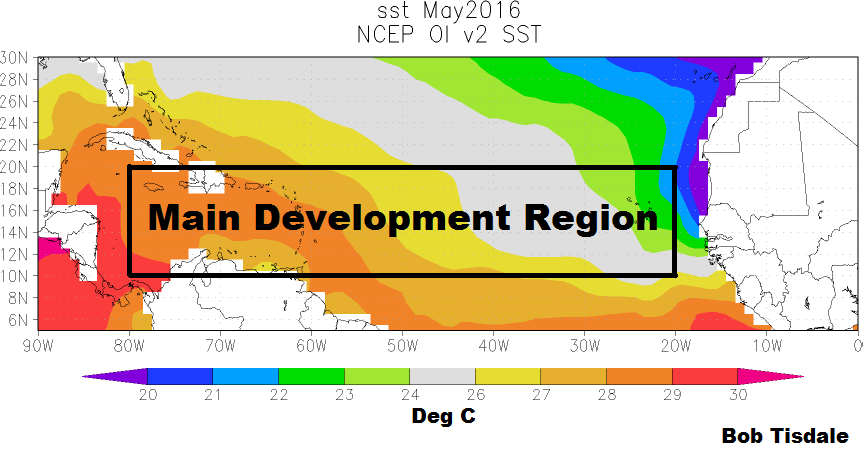
The Main Development Region of the North Atlantic (10N-20N, 80W-20W) is where hurricanes tend to form, although they can develop outside that region. See the National Hurricane Center Tropical Cyclone Climatology webpage, specifically the maps of their origins by 10-day periods. And the hurricane season runs from June 1st through November 30th.
Sea surface temperature is one of the many factors that contribute to hurricanes. The generally quoted the threshold for hurricane development and maintenance is 26 deg C (about 79 deg F). We recently illustrated the observed and modeled average annual cycle in the sea surface temperatures of the Main Development Region based on the averages for the past 30 years in the post Hurricane Main Development Region of North Atlantic – Climate Model-Simulated Sea Surface Temperatures Are Too Cool. I’ve removed the model curve in Figure 1 so not to distract from this discussion.
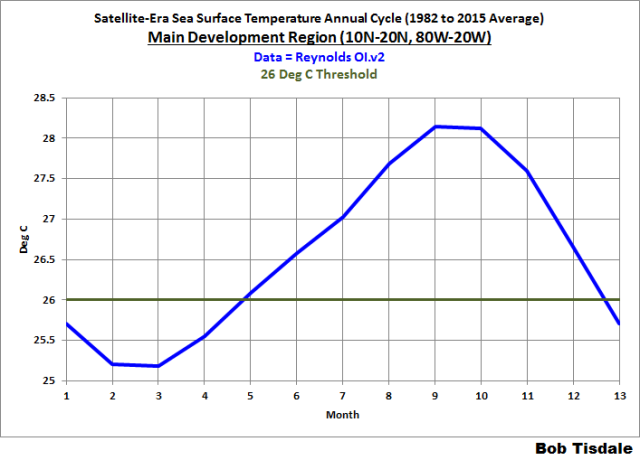
Figure 1
As illustrated, the most-recent 30-year average shows sea surface temperatures for the Main Development Region above the threshold of 26 deg C for most of the year, from late April to late December. And we can see that surface temperatures typically peak there in September and October.
SEA SURFACE TEMPERATURES AND ANOMALIES AT THE START OF THE 2016 SEASON
There are a number of ways to show the current sea surface temperature values. Using the satellite-enhanced Reynolds OI.v2 data from NOAA, we can present the sea surface temperature anomalies, referenced to the WMO-preferred period of 1981-2010. See Figure 2. As shown, the June 2016 temperature anomaly is +0.35 deg C, which is above normal, but nowhere near record highs, even in the wake of the 2015/16 El Niño.

Figure 2
Another way is to present only the June sea surface temperatures from the start of the Reynolds data in 1982 to now. See Figure 3.

Figure 3
As expected, the June 2016 sea surface temperatures of the Main Development Region are above the 26 deg C threshold, but there’s nothing unusual about the reading at the start of this year’s hurricane season. In fact, sea surface temperatures for the Main Development Region were roughly the same back in 1983, in the wake of the 1982/83 El Niño. Now consider that the volcanic aerosols from the 1982 eruption of Mexico’s El Chichon should have lowered the 1983 value.
Updated versions of Figures 2 and 3 will be included in the Monthly Sea Surface Temperature Updates.
DATA AND SOURCE
The sea surface temperature data in this post is the original (weekly/monthly, 1-deg spatial resolution) version of NOAA’s Optimum Interpolation (OI) Sea Surface Temperature (SST) v2 (aka Reynolds OI.v2)…not the (over-inflated, out-of-the-ballpark, extremely high warming rate) high-resolution, daily version of NOAA’s Reynolds OI.v2 data, which we illustrated and discussed in the recent post On the Monumental Differences in Warming Rates between Global Sea Surface Temperature Datasets during the NOAA-Picked Global-Warming Hiatus Period of 2000 to 2014.
The source of the Reynolds OI.v2 data is the KNMI Climate Explorer.


Pingback: July 2016 Sea Surface Temperature (SST) Anomaly Update | Bob Tisdale – Climate Observations
Pingback: August 2016 Sea Surface Temperature (SST) Anomaly Update | Bob Tisdale – Climate Observations
Pingback: September 2016 Sea Surface Temperature (SST) Anomaly Update | Bob Tisdale – Climate Observations
Pingback: November 2016 Sea Surface Temperature (SST) Anomaly Update | Bob Tisdale – Climate Observations