
INTRODUCTION
In the post Is Ocean Heat Content Data All It’s Stacked Up to Be?, we discussed and illustrated, for the depths of 0-700 meters, that the NODC’s pentadal ocean heat content had a significantly higher warming trend than the annual data. Refer to the discussions of Figures 5 to 7 under the heading of PENTADAL DATA IS NOT THE SAME AS DATA SMOOTHED WITH A 5-YEAR FILTER. For 0-700 meters, the pentadal data warms at a rate that’s about 19% higher than the annual data. I ended that section of the post with:
It really makes one wonder how strongly the warming rate of the 0-2000 meter data, which relies on much fewer observations below 700 meters, is impacted by the use of “running 5-year composites.”
In this post, we’ll present the same comparisons, but for the depths of 0-2000 meters. Somehow, the pentadal data adds about 36% to the warming trend of global ocean heat content above the warming trend of the annual data for the same depths.
THE ANNUAL DATA (0-2000 METERS) IS NO LONGER AVAILABLE FROM NODC
After preparing the post linked above, I remembered that I had presented the NODC’s quarterly ocean heat content data for the depths of 0-2000 meters in an October 24, 2010 post Introduction to the NODC Ocean Heat Content Data for the Depths of 0-2000 Meters. I still had the quarterly data, which was a good thing, because the NODC removed it as soon as they uploaded the pentadal data. Hopefully other bloggers had downloaded the 0-2000 meter data in annual or quarterly formats prior to its removal and can confirm the results of this post. I did a spot check, and the annual global data for 0-700 meters are the same now as they were in October 2011—with the exception of a minor correction to the 2010 value.
Note: I’m not the only person who has presented the NODC’s ocean heat content data for 0-2000 meters in quarterly or annual formats. It was referred to and plotted by a few bloggers at Skeptical Science. See their post Ocean Heat Poised to Come Back and Haunt Us. It was presented first by blogger JosHag at 20:17 PM on 15 October, 2011 in “Heat Uptake” form (The screen cap here, just in case SkepticalScience elects to delete it.). Then blogger Jsquared at 20:42 PM on 17 October, 2011 presented a comparison of annual Northern Hemisphere and Southern Hemisphere data for 0-700m and 0-2000m. (Screen cap here.)
PENTADAL VERSUS ANNUAL OCEAN HEAT CONTENT FOR 0-2000 METERS
Figure 1 compares the annual global ocean heat data (0-2000 meters) to the same data smoothed with a 5-year running average filter. The trends are basically the same, as one would expect.

Figure 1
Let’s delete the annual data and then compare the 5-year running mean of the annual global data to the pentadal data, Figure 2. Just like magic, based on the linear trends, the pentadal data increases the warming rate by 36%.
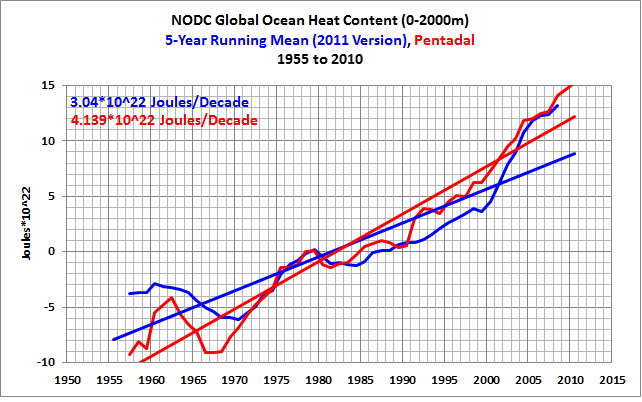
Figure 2
That’s an exaggeration of the comparison of the pentadal and annual data for the depths of 0-700 meters, Figure 7, from that previously linked post (here it is again).
CREATING SOMETHING FROM NOTHING
Figure 3 compares the annual global ocean heat content for the depths of 0-700 meters and 0-2000 meters. The warming rate for the depths of 0-2000 meters is about 21% higher than for the 0-700 meters data. But note, the two datasets are extremely similar from 1970 to 2003. There are some minor divergences during that period, but they appear to be warming at the same rate.

Figure 3
We’ll confirm that in Figure 4. The warming rates for the two depths are fundamentally the same for the period of 1970 to 2003. Could this be one of the reasons why the NODC removed the annual and quarterly data for 0-2000 meters?

Figure 4
The absence of warming from 700-2000 meters is consistent with the findings of Mauritzen et al (2012) Importance of density-compensated temperature change for deep North Atlantic Ocean heat uptake (paywalled). Refer to the discussion of that paper in the recent ocean heat content post (here), under the heading of SPEAKING OF STILL-TO-BE-DISCOVERED SUBSURFACE OCEAN PROCESSES.
And now for the comparison of the pentadal global ocean heat content for the depths of 0-700 meters and 0-2000 meters, Figure 5. The warming rate of the pentadal data for the depths of 0-2000 meters is about 36% higher than the data for 0-700 meters (compared to a faster rate of 21% for 0-2000 meters in the annual data, Figure 3).

Figure 5
Recall, there was no difference in the warming rates of the 0-700 meter and 0-2000 meter data in the annual data for the period of 1970 to 2003. Now, with the pentadal data, Figure 6, the 0-2000 meter data warms at a rate that’s 38% higher than the 0-700 meter data. With the pentadal data, the NODC has created ocean heat for the depths of 700-2000 meters during this period where none exists in the annual data.

Figure 6
ANOTHER CURIOSITY
Did you note that the warming rate of the pentadal data for the depths of 0-700 meters (Figure 2) was exactly the same as the trend for the annual data for 0-2000 meters (Figure 5)? Refer to Figure 7. The curves are different, but the trends are the same.

Figure 7
CLOSING
The NODC’s pentadal data at both depths don’t appear to be credible. That’s about as nice as I can phrase that statement.
If I can make a few recommendations to the NODC:
1. Post the annual and quarterly data for the depths of 0-2000 meters and toss the pentadal data. The pentadal data looks contrived—like you’ve tortured your ocean heat content data until it gave you the answer you wanted. It’s a sad thing to say, but that seems to be becoming standard operating procedure for the climate science community.
2. And looking at how well the 0-700 and 0-2000 meter data track from 1970 to 2003, you may want to look again at your climatologies, because the warming rates in recent years appear as though they still may be impacted by the significant increases in sampling with ARGO.
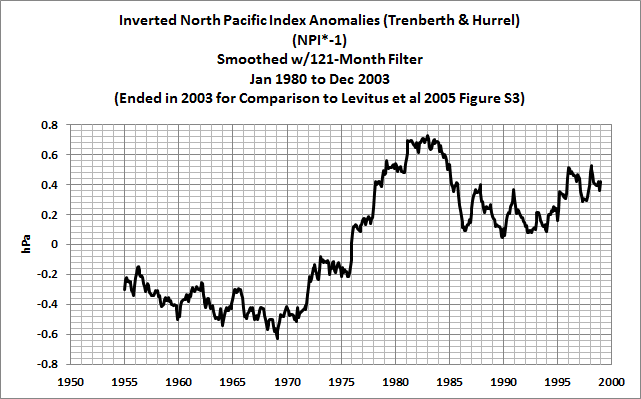
3. And, of course, you really should reexamine the 1970s to 1980s hump. As presented in my recent detailed discussion of ocean heat content data, the hump exists in other data—like sea level pressure. And I believe you’ll find the double “Bactrian camel” hump that appears in the 2005 version of the NODC ocean heat content data for the Indian Ocean is also present in the sea level pressure data of Indian Ocean.


Pingback: More on Trenberth’s Missing Heat | Bob Tisdale – Climate Observations
Pingback: More on Trenberth’s Missing Heat | Watts Up With That?
Pingback: Ocean Heat Content (0 to 2000 Meters) – Why Aren’t Northern Hemisphere Oceans Warming During the ARGO Era? | Bob Tisdale – Climate Observations
Pingback: Ocean Heat Content (0 to 2000 Meters) – Why Aren’t Northern Hemisphere Oceans Warming During the ARGO Era? | Watts Up With That?
Pingback: Even More about Trenberth’s Missing Heat – An Eye Opening Comment by Roger Pielke Sr. | Bob Tisdale – Climate Observations
Pingback: Even More about Trenberth’s Missing Heat – An Eye Opening Comment by Roger Pielke Sr. | Watts Up With That?
Pingback: Open Letter to the Royal Meteorological Society Regarding Dr. Trenberth’s Article “Has Global Warming Stalled?” | Bob Tisdale – Climate Observations
Pingback: Open Letter to the Royal Meteorological Society Regarding Dr. Trenberth’s Article “Has Global Warming Stalled?” | Watts Up With That?
Pingback: Rough Estimate of the Annual Changes in Ocean Temperatures from 700 to 2000 Meters Based on NODC Data | Bob Tisdale – Climate Observations
Pingback: Rough Estimate of the Annual Changes in Ocean Temperatures from 700 to 2000 Meters Based on NODC Data | Watts Up With That?
Pingback: Are Oceans Warming While Global Surface Temperatures are Stalling? | The Global Warming Policy Foundation (GWPF)
Pingback: AMAZING: The IPCC May Have Provided Realistic Presentations of Ocean Heat Content Source Data | Bob Tisdale – Climate Observations
Pingback: AMAZING: The IPCC May Have Provided A Realistic Illustration | Watts Up With That?
Pingback: Untruths, Falsehoods, Fabrications, Misrepresentations — Part 2 | Bob Tisdale – Climate Observations
Pingback: Comments on Stefan Rahmstorf’s Post at RealClimate “What ocean heating reveals about global warming” | Bob Tisdale – Climate Observations
Pingback: Comments on Stefan Rahmstorf’s Post at RealClimate “What ocean heating reveals about global warming” | Watts Up With That?
Pingback: Trenberth and Fasullo Try to Keep the Fantasy Alive | Bob Tisdale – Climate Observations
Pingback: Trenberth and Fasullo Try to Keep the Fantasy Alive | Watts Up With That?
Pingback: If Manmade Greenhouse Gases Are Responsible for the Warming of the Global Oceans… | Bob Tisdale – Climate Observations
Pingback: If Manmade Greenhouse Gases Are Responsible for the Warming of the Global Oceans… | Watts Up With That?
Pingback: Deep Ocean Geothermal Heat and OHC | Thongchai Thailand