
The KNMI Climate Explorer has added a number of datasets to their Monthly observations webpage, where users select desired data based on global coordinates. (Many thanks to Dr. Geert Jan van Oldenborgh of KNMI.) The new datasets include, under the heading of Ocean mean temperature, the National Oceanographic Data Center (NODC) Vertically Averaged Temperature Anomaly data of the global oceans. The data are supported by the Levitus et al. (2009) (2012) paper World Ocean Heat Content and Thermosteric Sea Level change (0-2000 m),1955-2010. Basically, the NODC Vertically Averaged Temperature data are the temperature component of their Ocean Heat Content data. KNMI has added the vertically averaged temperature anomaly data for the depth ranges of 0-100 meters (1955 to present), 0-700 meters (1955 to present) and 0-2000 meters (2005 to present).
Note: KNMI has also added to their Climate Explorer the Japanese Meteorological Agency (JMA) Ocean Heat Content data for the depths of 0-700 meters. We’ll compare them to the NODC’s data in a future post.
In this post we’ll take a quick look at the vertically averaged temperature anomaly data for 0-2000 meters. That’s the period when subsurface temperature measurements are dominated by ARGO floats, providing a reasonably complete view of ocean temperatures to depths of 0-2000 meters. We’ll examine the other depth ranges in future posts.
PRELIMINARY NOTE
The NODC present their data on a quarterly basis. KNMI has converted it to monthly data by assigning the quarterly values to each of the respective months. As a result, the monthly data take on a step-like appearance, with lots of little plateaus. We could smooth the data with 3-month filters to eliminate those tiny steps, but in this post it would serve little value because we’re looking primarily at warming (and cooling) rates.
GLOBAL AND HEMISPHERIC WARMING RATES
Figure 1 presents the NODC vertically averaged temperatures anomalies, for the depths of 0-2000 meters, for the 1st quarter of 2005 through the 2nd quarter of 2014. Since the 1st quarter of 2005, the oceans of the Southern Hemisphere for the depths of 0-2000 meters have warmed at a rate of about +0.05 deg C/decade, based on the linear trend. On the other hand, the linear trend for the Northern Hemisphere oceans is considerably less, warming at a rate that’s about 10% of the Southern Hemisphere rate. That’s quite a difference in a world where manmade greenhouse gases are supposedly responsible for the warming and where manmade greenhouse gases are said to be well mixed.
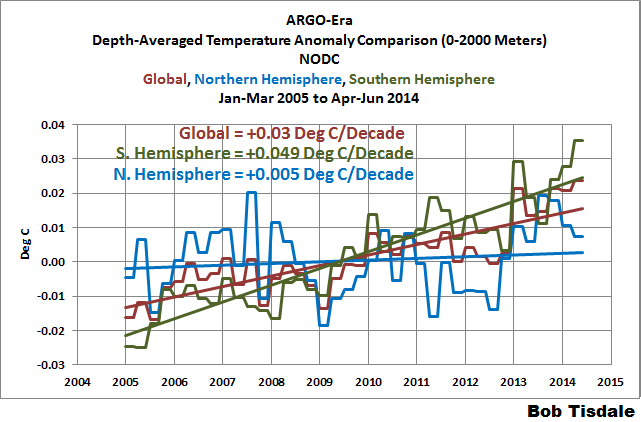
Figure 1
OCEAN BASIN COMPARISONS
I’ve divided the ocean basins into subsets using the same coordinates I use for the sea surface temperature updates:
- Arctic (65N-90N)
- North Atlantic (0-70N, 80W-0)
- North Pacific (0-65N, 100E-90W)
- Indian (60S-30N, 20E-120E)
- South Atlantic (60S-0, 70W-20E)
- South Pacific (60S-0, 120E-70W)
- Southern (90S-60S)
The cooling rate of the Arctic Ocean is so out of proportion to the other ocean basins that I’ve shown it separately in Figure 2. One would want to attribute the spike in 2007 to the seasonal sea ice loss that year. Curiously, similar spikes do not appear during 2012 and 2013 when there were comparable or greater seasonal losses.
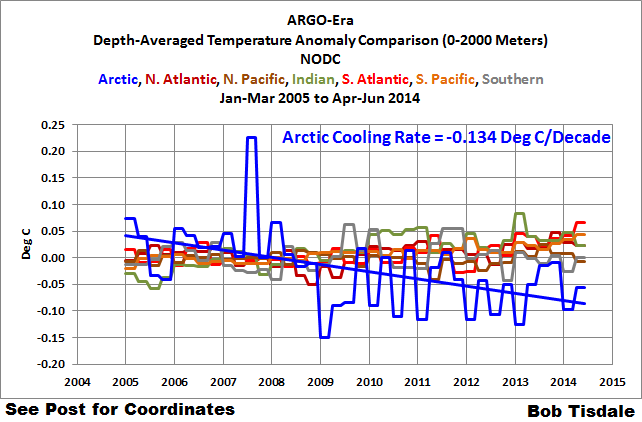
Figure 2
I’ve excluded the Arctic Ocean from Figure 3. As shown, there is a wide range of warming rates for the rest of the ocean basins to depths of 2000 meters. The Indian Ocean has had the greatest warming during the ARGO era, more than twice the warming rates of the South Atlantic and South Pacific, and about 3 times higher than the rate of the North Atlantic. Yet, for the depths of 0-2000 meters, the North Pacific and the Southern Ocean surrounding Antarctica show basically no warming over the past decade.
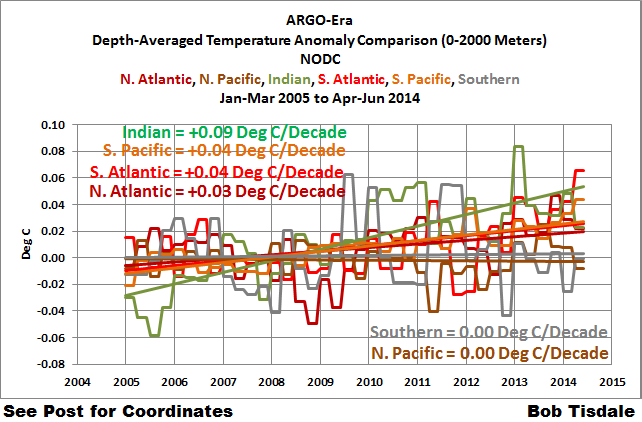
Figure 3
WHICH LATITUDES WARMED AND WHICH ONES COOLED
Figure 4 presents the warming and cooling rates (deg C/decade) of the global oceans on a latitudinal-average (zonal-means) basis. The vertical axis (y-axis) is scaled in deg C/decade. The horizontal axis (x-axis) is scaled in degrees latitude, with the South Pole on the left at -90 (or 90S), with the North Pole on right at +90 (or 90N) and with the equator at the center at zero degrees latitude.
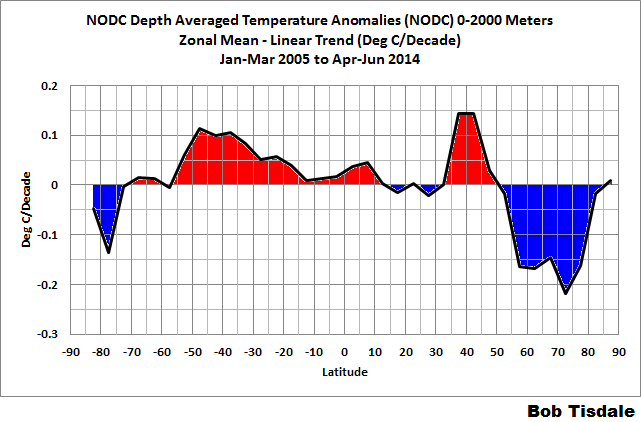
Figure 4
During the ARGO era, the greatest warming to depths of 2000 meters occurred at the lower mid-latitudes of the Northern Hemisphere and the mid-latitudes of the Southern Hemisphere. The greatest cooling occurred in the mid-to-high latitudes of the Northern Hemisphere, with a comparatively slight cooling in the lower latitudes of the Northern Hemisphere and in the Southern Ocean surrounding Antarctica. Note also that the cooling in the Northern Hemisphere encompasses more than the Arctic.
Regional ocean cooling to depths of 0-2000 meters is difficult to reconcile in a world where greenhouse gases are supposed to dominate climate. If natural factors can cause the oceans to cool, they can also contribute to the warming.
CLOSING COMMENT
For a couple of years, we’ve been illustrating and discussing how horrendously the latest and greatest climate models simulate the surface temperatures of the global oceans. See the most recent posts:
- Maybe the IPCC’s Modelers Should Try to Simulate Earth’s Oceans, and
- IPCC Still Delusional about Carbon Dioxide
Some readers might suspect that if the models cannot simulate the surface temperatures of the oceans, they will prove no better when attempting to simulate the warming and cooling to depths of 2000 meters. Unfortunately, the climate model outputs for subsurface ocean temperatures are not presented in formats so that they can be easily added to the KNMI Climate Explorer. And it’s unlikely that the climate science community will present those model failings.


Thanks, Bob, for a clear view of the world ocean’s first 2,000 m temperature history.
Fascinating.
What is the base averaged temperature used to calculate the anomaly for 0-2000 meters?
Which year or years average temperature was considered as base temperature ?
Hi, Ashok Patel. The NODC does not present it’s data in absolute form, so I can’t tell you what they’ve used as the based averaged temperature.
Given the amounts of the variation from zero, these all look like they are very possibly measurement noise. This conclusion is, IMO, inescapable.
If the high latitutudes are cooling, and the Indian Ocean is warming then we could conclude whatever transfers cold bottom water from the Southern Ocean into the Indian Ocean must have a reduced flow? Is this a sensible conclusion?
Fernando Leanme, my understanding of flow in the abyss is that it is very slow. I suspect the warming in the Indian Ocean and the cooling at high latitudes are caused by separate processes.
Cheers.
Reblogged this on CRIKEY !#&@ …… IT'S THE WEATHER CYCLES and commented:
BOB has compiled some outstanding time series graphs comparing different ocean basins and there warming or cooling anomalies
Forget the boring title Bob has given.. Go in and enjoy this feast of information you MUST have ..
THE ARCTIC BASIN IS COOLING FASTER THAN ANY OTHER BASIN SINCE 2004 AND THERE IS MORE
There is a lot of explaining to do from the results of these graphs whether you are a proponent of AGW or a cycle researcher. Great findings BOB..A treasure trove of mystery here
From a global cooling argument/ process , one could infer the earth cools from the poles first and then to ward the mid – latitudes
Re: the Arctic anoml;ay 2007 . Cycle research has taught me that a shift in cycle phase or rhythm is often punctuated with a strong anomaly
Maybe the warming SH trend is a product of the bi-polar see saw .hypothesis
cheers
Heat flows into the ocean’s top surface from the sun. Ocean currents distribute it into various regions of the ocean by vertical and horizontal flow. I don’t see how one can conclude that local differences in heat gain of the ocean bulk imply that overall heating of the earth by the greenhouse effect is not happening. In fact data shows that when the change in heat of all of the oceans is added up, the oceans have been gaining heat over the past decade, about 10^23 joules worth.
Hi eadler2. You’re wasting your time here, as well as wasting mine.
Your comment reminds me of the Monty Python argument-contradiction skit.
In the post, I presented data that show the warming isn’t uniform and questioned whether the hypothesis of human-induced global warming supported ocean basins not warming for a decade…some of them cooling. Your failed argument against my observation was simply to present the total once again, completely overlooking the fact that individual basins had not warmed. You must be hanging out over at HotWhopper. That sounds like Miriam O’Brien (Sou) logic.
Let’s make it easier to see. Here’s a comparison graph of the annual depth-averaged temperature anomalies for the North Atlantic, South Atlantic, Indian, and Pacific Oceans for the depths of 0-2000 meters:

The data are directly from the NODC website, but zeroed in 2005. You could use their annual ocean heat content data as well. It makes little difference.
Notice that the warming is confined primarily to two ocean basins, the Indian and South Atlantic. They only cover about 1/3 of the surface of the area covered by the group. That means that other two ocean basins that cover the other 2/3 show no warming. So I’m showing you that there has been no warming to depths of 2000 meters for two ocean basins that cover about 2/3 of the global oceans represented by the NODC data.
But you’re telling me that globally the oceans are warming. Sorry. That doesn’t work. You haven’t explained why the North Atlantic and the largest ocean basin on this planet show no heat uptake for a decade.
Last, you can’t say the oceans are warming below 2000 meters. There’s a recent paper by Josh Willis that says there hasn’t been any warming at those depths.
Please don’t waste my time again.
Hi Bob,
Thanks for all the time and effort you put into these posts here and at WUWT. I’ve learned a lot from them.
This post shows 0-2000m data.
Do you have a recent plot of 0-700m data for the various ocean basins?
The most recent one here: http://tinypic.com/view.php?pic=2llhpva&s=7#.VJiiC_8M8CY that I found was only up to 2011.
A second question, does KMNI have gridded cloud data, like from ISCCP? If so, it might definitively show if changes in cloud amount, allowing more or less solar radiation to reach the ocean surface, were linked to increases and decreases in various ocean basin OHC changes.
Thanks,
ROO2
ps. I’ve interacted with an Eric Adler in other blog comments, if he’s the same eadler2. He demonstrates the same lack of logic and fits your Monty-Python argument-contradiction skit.
I had made a point that global mean cloud amount had decreased during the last couple decades of the 20th century and very likely did contribute to the late 20th century warming. Herman et. al., 2013 ‘A net decrease in Earth’s cloud, aerosol, and surface 340nm reflectivity during the past 33 yrs (1979-2011)’ found a 2.7 W/m^2 increase in global solar energy reaching the Earth’s surface, with a large increase in the “equatorial region associated with ENSO”. Hatzianastassiou et. al., 2005 ‘Global distribution of Earth’s surface shortwave radiation budget’ found a 4.1 W/m^2 increase in downward surface radiation.
Adler’s response was “clouds spring up quickly and dissipate quickly” and “they can not be a driver of climate change” and “they are regarded as a feedback mechanism by all climate scientists”. His many other responses were equally irrelevant. You pegged him quickly.
RealOldOne2, I haven’t plotted NODC OHC or depth averaged-temperature for 0-700m for a while…other than the breakdowns for the tropical Pacific, extratropical North Pacific and North Atlantic during discussions of natural variability.
The KNMI Climate Explorer does have ISCCP cloud amount data but it only runs through 2006. Cloud amount data also used to be available as part of the NCEP-DOE Reanalysis-2 outputs at the NOAA NOMADS website, but it’s been down for months.
Cheers.
I am clipping the graph that shows the Arctic Ocean cooling. and plan to use it in a sea-ice post at my site. (see: https://sunriseswansong.wordpress.com/2015/06/27/arctic-sea-ice-continued-concentration-on-quietudes-quirks/ ) I will give you credit and compliment your site. If you don’t want me to use it, please inform me and I’ll remove it, (without removing the compliments).
Do you have any updated versions of this graph?
Caleb, that’s the most current one. Sorry.
Pingback: Nieves et al. – Another excuse for ‘the pause': Redistribution of Heat in Oceans | Watts Up With That?
Pingback: New Paper Calls into Question Reanalysis-Based and Climate Model-Based Explanations for the Slowdown in Global Surface Warming | Bob Tisdale – Climate Observations
Pingback: Deep Ocean Warming in Degrees C | Bob Tisdale – Climate Observations
Pingback: Deep Ocean Warming in Degrees C | Watts Up With That?
Pingback: Deep Ocean Warming in Degrees C |