
ABOUT THE ERROR-LADEN FIRST VERSION OF THIS POST
I displayed my very limited understanding of statistics in my post On Foster and Rahmstorf 2011 – Global temperature evolution 1979–2010. This was pointed out to me a great number times by many different people in numerous comments received in the WattsUpWithThat cross post. My errors in that portion of the post were so many and so great that they detracted from the bulk of the post, which was about the El Niño-Southern Oscillation. For that reason, I have added a third update to my earlier post on Foster and Rahmstorf (2011), which asks readers to disregard that post and the cross post at WUWT. That update also includes a link that redirects readers here.
I learned a lot from my mistakes. Many of those who commented provided detailed explanations of the methods used by Foster and Rahmstorf (2011). Thanks go to them.
When an author of a blog post makes a major mistake, it needs to be acknowledged and/or corrected, and I have done this multiple times for that portion of my earlier post about Foster and Rahmstorf (2011). Now I’m reposting an expanded version of the discussion of ENSO. If you’d still like to discuss the errors I made in the earlier post, please comment on that thread, not this one.
OVERVIEW
This post discusses the assumption made in the paper Foster and Rahmstorf (2011) “Global Temperature Evolution 1979–2010”that the variations in the global temperature record due to El Niño-Southern Oscillation (ENSO) can be estimated from an ENSO index. This post excludes all discussions of the statistical methods used by Foster and Rahmstorf in their paper. Please limit the comments on this thread to ENSO and surface temperature responses to ENSO.
INTRODUCTION
Foster and Rahmstorf (2011) attempted to remove from 5 global temperature datasets the linear effects of 3 factors that are known to cause variations in global temperature. The paper covered the period of 1979 to 2010. The intent of their paper was to show that anthropogenic global warming continues unabated in all of those datasets. The independent variables listed in the abstract of Foster and Rahmstorf (2011) are El Niño-Southern Oscillation (ENSO), volcanic aerosols, and solar variations.
Foster and Rahmstorf (2011) used independent measures for these three factors. Total Solar Irradiance and aerosol optical depth data were used to estimate the effects of solar variability and volcanic aerosols on global surface temperatures. This post does not pertain to them. This post initially discusses the attempt by Foster and Rahmstorf (2011) to use an ENSO index as a measure of the effects of ENSO on global surface temperature. What will then be discussed and shown is that an ENSO index cannot account for the effects of ENSO on global surface temperatures.
Foster and Rahmstorf (2011) also makes two more assumptions that have little basis in reality. They assume the rise in surface temperatures since 1979 was linear and that it was due to anthropogenic factors. The sea surface temperature record of the global oceans since 1982 clearly disagrees with these assumptions.
ENSO IS NOT AN EXOGENOUS FACTOR
The following two papers discuss the problems with the assumption made by Foster and Rahmstorf (2011) about ENSO. One of the papers was cited by them in their paper.
Foster and Rahmstorf (2011) cited Trenberth et al (2002) Evolution of El Nino–Southern Oscillation and global atmospheric surface temperatures”as one of their ENSO references. But Trenberth et al (2002) include the following disclaimer in the second paragraph of their Conclusions, (their paragraph 52, my boldface):
The main tool used in this study is correlation and regression analysis that, through least squares fitting, tends to emphasize the larger events. This seems appropriate as it is in those events that the signal is clearly larger than the noise. Moreover, the method properly weights each event (unlike many composite analyses). Although it is possible to use regression to eliminate the linear portion of the global mean temperature signal associated with ENSO, the processes that contribute regionally to the global mean differ considerably, and the linear approach likely leaves an ENSO residual.
The ENSO “residuals” are a significant contributor to the rise in Global Sea Surface Temperatures during the satellite era, as will be shown later in this post. Did Foster and Rahmstorf (2011) consider these residuals in their analysis? No.
A more recent paper was overlooked by Foster and Rahmstorf (2011). Compo and Sardeshmukh (2010) “Removing ENSO-Related Variations from the Climate Record” seems to be a step in the right direction. They write (my boldface):
An important question in assessing twentieth-century climate is to what extent have ENSO-related variations contributed to the observed trends. Isolating such contributions is challenging for several reasons, including ambiguities arising from how ENSO is defined. In particular, defining ENSO in terms of a single index and ENSO-related variations in terms of regressions on that index, as done in many previous studies, can lead to wrong conclusions. This paper argues that ENSO is best viewed not as a number but as an evolving dynamical process for this purpose.
Note: While Compo and Sardeshmukh made a step in the right direction, they missed a very important aspect of ENSO. They overlooked the significance of the huge volume of warm water that is left over from certain El Niño events, and they failed to account for its contribution to the rise in global Sea Surface Temperature anomalies since about 1975/76.
ENSO IS A PROCESS NOT AN INDEX
I have discussed, illustrated, and animated the process of ENSO and its effects on global surface temperatures and lower troposphere temperatures for about three years. There are too many posts to list them all here. However, if the subject of ENSO is new to you, refer to the introduction post here. If you would prefer an introductory-level discussion about ENSO written by someone else, refer to the excellent answers to FAQ here by Bill Kessler of the NOAA Pacific Marine Environmental Laboratory. For those who believe La Niña events are the opposite of El Niño events refer to the posts here, here and here. And for those who believe ENSO is represented by an index, refer to the post here. I will provide a relatively detailed overview of the process of ENSO in the following.
ENSO is a coupled ocean-atmosphere process that periodically discharges heat to the atmosphere during an El Niño. The phrase “coupled ocean-atmosphere process” refers to the fact that many ocean and atmospheric variables in the tropical Pacific interact with one another. For that reason, a number of tropical Pacific variables are impacted directly by ENSO, including sea surface temperature, sea level, ocean currents, ocean heat content, depth-averaged temperature, warm water volume, sea level pressure, cloud amount, precipitation, the strength and direction of the trade winds, etc. I have presented the effects of ENSO on each of those variables in past posts. And since cloud amount for the tropical Pacific impacts downward shortwave radiation (visible light) there, I’ve presented and discussed that relationship as well. In fact, the videos included in the post herepresented ISCCP Total Cloud Amount data (with cautions about that dataset), CAMS-OPI precipitation data, NOAA’s Trade Wind Index (5S-5N, 135W-180) anomaly data, RSS MSU TLT anomaly data, CLS (AVISO) Sea Level anomaly data, NCEP/DOE Reanalysis-2 Surface Downward Shortwave Radiation Flux (dswrfsfc) anomaly data, and Reynolds OI.v2 SST anomaly data.
During an El Niño, warm water from the west Pacific Warm Pool can travel thousands of miles eastward across the equatorial Pacific. Keep in mind that the equatorial Pacific stretches almost halfway around the globe. So as the convection, cloud cover, and precipitation all accompany that warm water, their relocation causes changes in atmospheric circulation patterns worldwide. In turn, this causes temperatures outside of the eastern tropical Pacific to vary, some warming, some cooling, but in total, the areas that warm exceed those that cool and global surface temperatures rise in response to an El Niño. The spatial patterns of warming and cooling during a La Niña are similar to an El Niño, but of the opposite sign. And all that a paper such as Foster and Rahmstorf (2011) can only hope to account for are the changes in global temperature that respond linearly to the changes in the ENSO index used in the analysis. As confirmation, a paper cited by Foster and Rahmstorf (2011) acknowledged that there are ENSO-related factors that impact global temperatures that are overlooked by linear regression analysis. See Trenberth et al (2002) linked above.
Because global spatial patterns for El Niño and La Niña events are similar but opposite, many persons believe that all of the effects of El Niño and La Niña events oppose one another. This is far from reality. A La Niña event is basically an exaggeration of the “normal” (or ENSO-neutral) state of the tropical Pacific, while an El Niño event is an anomalous state.
An El Niño can carry huge volumes of warm water from the surface and below the surface of the west Pacific Warm Pool eastward to the central and eastern equatorial Pacific. That warm water is not consumed fully by the El Niño, so it returns to the west during the La Niña. One of the ways the La Niña accomplishes this return of warm water is through a phenomenon called a slow-moving Rossby wave, which forms in the northeast tropical Pacific at about 5N-10N. After the 1997/98 El Niño, the Rossby wave is plainly visible in ocean heat content anomaly animations, and better still in sea level residual animations from the Jet Propulsion Laboratory.
I’ve highlighted the Rossby wave in screen captures from the JPL video in Figure 1. The upper right-hand cell shows the formation of the Rossby wave and the lower left-hand cell captures the Rossby wave travelling from east to west at approximately 5N-10N, carrying leftover warm water back to the western Pacific during the transition from the 1997/98 El Niño to the multiyear La Niña that followed.

Figure 1
The Rossby wave can be seen in the first 10 to 15 seconds of Video 1. And as you will note, if you allow the video to play through, there are no comparably sized Rossby waves carrying cool waters back to the western tropical Pacific at 5N-10N after the La Niña.
Video 1
And to further confirm this basic difference between El Niño and La Niña events, there are also no comparably-sized Rossby waves carrying cool waters back to the western tropical Pacific at 5N-10N after any La Niña event seen in the full version of the JPL animation, Video 2, which runs from 1992 to 2002.
Video 2
There are no ENSO indices presently in use that can account for the return of the warm water to the West Pacific during a La Niña event that follows an El Niño.
As I’ve noted in numerous posts, ENSO is also a process that redistributes the warm water that was leftover from the El Niño itself and enhances the redistribution of the warm water that resulted from the El Niño in waters outside of the eastern tropical Pacific. The redistribution carries that warm water poleward and into adjoining ocean basins during the La Niña that follows an El Niño. The impacts of this redistribution depend on the strength of the El Niño and the amount of water that was “left over”. Lesser El Niño events that are not followed by La Niña events obviously would not have the same impacts. There are no ENSO indices that can account for this redistribution and these differences.
La Niña events also recharge part of the warm water that was released during the El Niño. They accomplish this through an increase in downward shortwave radiation (visible light), and that results from the reduction in tropical Pacific cloud amount caused by the stronger trade winds of a La Niña. Sometimes La Niña events “overcharge” the tropical Pacific, inasmuch as they recharge more ocean heat in the tropical Pacific than was discharged during the El Niño that came before it. That was the case during the 1973/74/75/76 La Niña. Refer to Figure 2. Tropical Pacific Ocean Heat Content rose significantly during the 1973/94/75/76 La Niña, and that provided the initial “fuel” for the 1982/83 Super El Niño and the multi-year 1986/87/88 El Niño. The La Niña events that followed those El Niño only recharged a portion of the heat discharged by them. Tropical Pacific Ocean Heat Content declined until 1995. Then the 1995/96 La Niña event “overcharged” the Tropical Pacific Ocean Heat Content again and that provided the fuel for the 1997/98 “El Niño of the Century”.
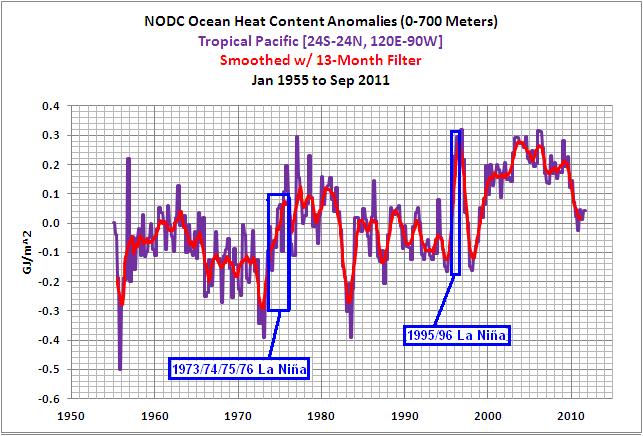
Figure 2
Refer also to the introductory level discussion in the post ENSO Indices Do Not Represent The Process Of ENSO Or Its Impact On Global Temperature.
THE TREND OF THE EAST PACIFIC SEA SURFACE TEMPERATURE ANOMALIES HAS BEEN RELATIVELY FLAT FOR 30 YEARS
The East Pacific Sea Surface Temperature anomalies from pole to pole, Figure 3, are dominated by the variations in tropical Pacific caused by ENSO, and as a result, the variations in the East Pacific Sea Surface Temperature anomalies mimic ENSO, represented by the scaled NINO3.4 Sea Surface Temperature anomalies. The trend of the East Pacific Sea Surface Temperature anomalies is relatively flat at 0.011 deg C/Decade.
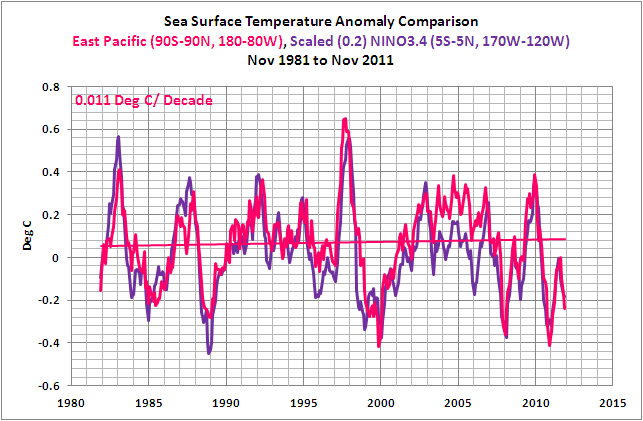
Figure 3
The reason the trend is so flat: warm water from the surface and below the surface of the west Pacific Warm Pool is carried eastward during an El Niño and spread across the surface of the eastern tropical Pacific, raising sea surface temperatures there. And during the La Niña events that follow El Niño events, the leftover warm water is returned to the western tropical Pacific. Due to the increased strength of the trade winds during the La Nina, there is an increase in upwelling of cool subsurface waters in the eastern equatorial Pacific, so the Sea Surface Temperatures there drop. In other words, the East Pacific is simply a temporary staging area for the warm water of an El Niño event. Warm water sloshes into this dataset from the western tropical Pacific and releases heat, and then the warm water sloshes back out.
WHAT EFFECT DOES THE WARM WATER HAVE WHEN IT RETURNS TO THE WESTERN TROPICAL PACIFIC DURING THE SUBSEQUENT LA NIÑA EVENT?
The warm waters released from below the surface of the West Pacific Warm Pool during a major El Niño are not done impacting Sea Surface Temperatures throughout the global oceans when that El Niño has ended, and they cannot be accounted for by an ENSO index. Keep in mind, during an El Niño like the 1997/98 event, a huge volume of water from below the surface of the west Pacific Warm Pool was spread across the surface of the eastern tropical Pacific. Consequently, warm water that had once been excluded from the surface temperature record, because it was below the surface, is now included in the surface temperature record. At the end of the El Niño, the trade winds push the warm water that’s now on the surface back to the western Pacific where it remains in the surface temperature record. The Sea Surface Temperature in the western Pacific rises as a result. Add to that the effects of the Rossby wave. As illustrated earlier, at approximately 5N-10N latitude, a slow-moving Rossby wave also carries leftover warm water from the eastern tropical Pacific back to the western Pacific during the La Niña. Ocean currents carry all of the leftover the warm water poleward to the Kuroshio-Oyashio Extension (KOE) east of Japan and to the South Pacific Convergence Zone (SPCZ) east of Australia, and the Indonesian Throughflow (an ocean current) carries the warm water into the tropical Indian Ocean. And as noted above, due to the increased strength of the trade winds during the La Nina, there is an increase in upwelling of cool subsurface waters in the eastern equatorial Pacific, so the Sea Surface Temperatures there drop. But that cooler-than-normal water is quickly warmed during the La Niña as it is carried west by the stronger-than-normal ocean currents that are caused by the stronger-than-normal trade winds. And the reason that water warms so quickly as it is carried west is because the stronger-than-normal trade winds reduce cloud cover, and this allows more downward shortwave radiation (visible sunlight) to warm the ocean to depths of 100 meters. This additional warm water helps to maintain the Sea Surface Temperatures in the West Pacific and East Indian Oceans at elevated levels during the La Niña and it also recharges the West Pacific Warm Pool for the next El Niño event. Refer again to Figure 2. (Keep in mind that the graph in Figure 2 is for the Ocean Heat Content for the entire tropical Pacific, not just the Pacific Warm Pool.)
And what happens when a major El Niño event is followed by a La Niña event? The Sea Surface Temperature anomalies for the Atlantic, Indian, and West Pacific Oceans (the Rest-Of-The-World outside of the East Pacific) first rise in response to the major El Niño; the 1986/87/88 and 1997/98 El Niño events for example. Then the Rest-Of-The-World Sea Surface Temperatures are maintained at elevated levels by the La Niña; the 1988/89 and 1998/99/00/01 La Niña events to complete the example. The results are the apparent upward shifts in the Sea Surface Temperature anomalies of the Atlantic, Indian, and West Pacific Oceans from pole to pole (90S-90N, 80W-180), as illustrated in Figure 14. Some have described it as a ratcheting effect, where the redistribution of warm waters during the major El Niño and La Niña events drive the surface temperatures up a notch.
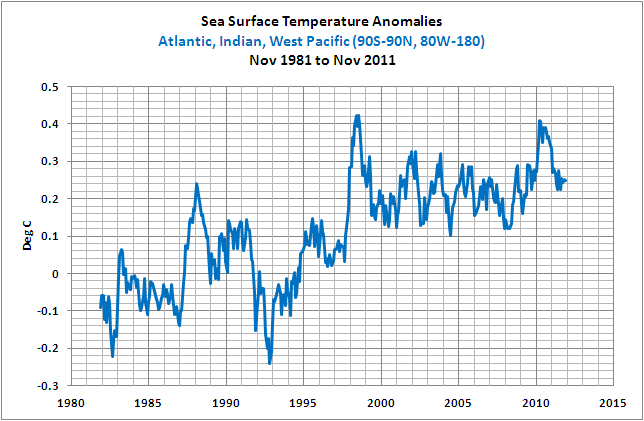
Figure 4
In Figure 4, the dip and rebound starting in 1991 is caused by the volcanic aerosols emitted by the explosive volcanic eruption of Mount Pinatubo. And the reason the Rest-Of-The-World Sea Surface Temperature anomalies respond so little to the 1982/83 Super El Niño is because that El Niño was counteracted by the eruption of El Chichon in 1982.
To assure readers that the upward shifts in Rest-Of-The-World Sea Surface Temperature anomalies coincide with the 1986/87/88 and 1997/98 El Niño events, I’ve included an ENSO index, NINO3.4 Sea Surface Temperature anomalies, in Figure 5. The NINO3.4 Sea Surface Temperature anomalies have been scaled (multiplied by a factor of 0.12) to allow for a better visual comparison, and shifted back in time by 6 months to account for the time lag between the variations in NINO3.4 Sea Surface Temperature anomalies and the response of the Rest-Of-The-World data.

Figure 5
But the ENSO Index data is visually noisy and it detracts from the upward shifts, so I’ve removed it in Figure 6. But in it, I’ve isolated the data between the significant El Niño events. To accomplish this, I used the NOAA Oceanic Nino Index (ONI) to determine the official months of those El Niño events. There is a 6-month lag between NINO3.4 SST anomalies and the response of the Rest-Of-The-World SST anomalies during the evolution phase of the 1997/98 El Niño. So the ONI data was lagged by six months, and the Rest-Of-The-World SST data that corresponded to the 1982/83, 1986/87/88, 1998/98, and 2009/10 El Niño events was excluded and left as black dashed lines. All other months of data remain and are represented by the blue curves.

Figure 6
And to help further highlight the upward shifts, the average Sea Surface Temperature anomalies between the major El Niño events are added in Figure 7.
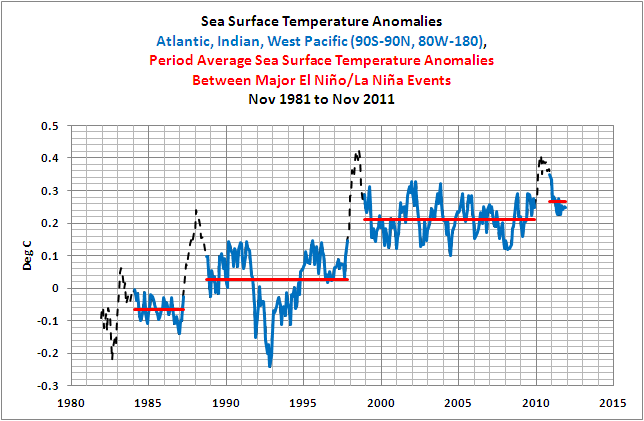
Figure 7
Based on past posts where I’ve presented the data the same way, some readers have suggested the period average temperatures are misleading and have requested that I illustrate the linear trends. Figure 8 shows how flat the trends are between the 1986/87/88 and 1997/98 El Niño events and between the 1997/98 and 2009/10 El Niño events.

Figure 8
Back to the East Pacific data: If we adjust the East Pacific Sea Surface Temperature anomalies for the effects of volcanic aerosols, Figure 9, the linear trend is slightly negative. In other words, for approximately 33% of the surface area of the global oceans, Sea Surface Temperature anomalies have not risen in 30 years.
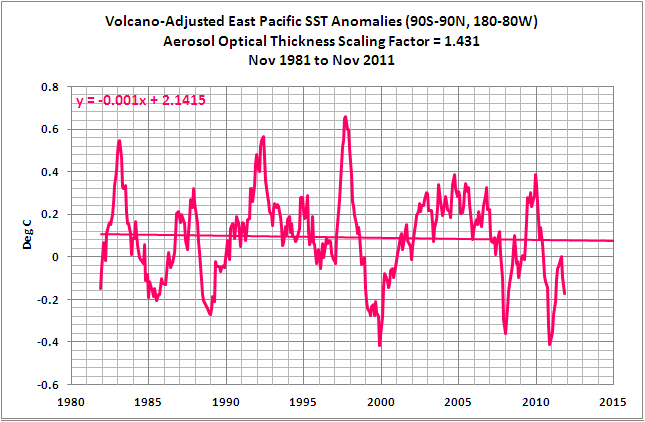
Figure 9
Note: The method used to adjust for the volcanic eruptions is described in the post Sea Surface Temperature Anomalies – East Pacific Versus The Rest Of The World, under the heading of ACCOUNTING FOR THE IMPACTS OF VOLCANIC ERUPTIONS.
And if we adjust the Rest-Of-The-World Sea Surface Temperature anomalies for volcanic aerosols, Figure 10, we reduce the effects of the dip and rebound caused by the 1991 eruption of Mount Pinatubo. And the trend of the Rest-Of-The-World data between the 1986/87/88 and 1997/98 El Niño drops slightly compared to the unadjusted data (Figure 8), making it even flatter and slightly negative.

Figure 10
Note: In the second part of a two part series (here), I further subdivided the Rest-of-the-World (90S-90N, 80W-180) sea surface temperature data to isolate the North Atlantic, due to its additional mode of natural variability. The sea surface temperatures for the remaining South Atlantic-Indian-West Pacific data decay between the major El Niño events. In other words, the sea surface temperatures there drop; the linear trends are negative, just as one would expect.
In summary, ENSO is a coupled ocean-atmosphere process and its effects on Global Surface Temperatures cannot be accounted for with linear regression of an ENSO index as attempted by Foster and Rahmstorf (2011)–and others before them. We can simply add Foster and Rahmstorf (2011) to the list of numerous papers that make the same error. Examples:
Lean and Rind (2009) How Will Earth’s Surface Temperature Change in Future Decades?
And:
Lean and Rind (2008) How Natural and Anthropogenic Influences Alter Global and Regional Surface Temperatures: 1889 to 2006
And:
Santer et al (2001), Accounting for the effects of volcanoes and ENSO in comparisons of modeled and observed temperature trends
And:
Thompson et al (2008), Identifying signatures of natural climate variability in time series of global-mean surface temperature: Methodology and Insights
And:
Trenberth et al (2002) Evolution of El Nino–Southern Oscillation and global atmospheric surface temperatures
And:
Wigley, T. M. L. (2000), ENSO, volcanoes, and record-breaking temperatures
IS THERE A LINEAR “GLOBAL WARMING SIGNAL”?
Foster and Rahmstorf (2011) assumed that the global warming signal is linear and that it is caused by anthropogenic factors, but those assumptions are not supported by the satellite-era Sea Surface Temperature record as shown above. The El Niño events of 1986/87/88 and 1997/98 are shown to be the cause of the rise in sea surface temperatures since November 1981, not anthropogenic greenhouse gases.
CLOSING COMMENTS
This post illustrated and discussed the error in the assumption that regression analysis can be used to remove the impacts of ENSO on Global Surface Temperature. ENSO is a process that is not fully represented by ENSO Indices. In other words, the ENSO indices only represent a small portion of the impacts of ENSO on Global Surface Temperatures. Attempting to use an ENSO index as Foster and Rahmstorf (2011) have done is like trying to provide the play-by-play for a baseball game solely from an overhead view of home plate.
The assumption made by Foster and Rahmstorf (2011) that a linear trend provides an approximate “global warming” signal was shown to be wrong using Sea Surface Temperature data. When broken down into two logical subsets of the East Pacific and the Atlantic-Indian-West Pacific Oceans, satellite-era Sea Surface Temperature data shows no evidence of an anthropogenic global warming signal. It only shows upward shifts associated with strong ENSO events.
If Foster and Rahmstorf (2011) were to exclude ENSO from their analysis, it is likely their results would be significantly different.
A closing note: I have also been illustrating, discussing, and documenting the ENSO-related processes behind these upward shifts for three years, using the East Indian-West Pacific subset (60S-65N, 80E-180). I first posted about it on January 10, 2008 in a two-part series here and here. The WattsUpWithThat cross posts are here and here.
ABOUT: Bob Tisdale – Climate Observations
SOURCES
The NODC OHC data is available through the KNMI Climate Explorer, on their Monthly observationswebpage.
The Reynolds OI.v2 Sea Surface Temperature data used in the ENSO discussion is available through the NOAA NOMADS website here.
The Aerosol Optical Thickness data used in the volcano adjustments of the Sea Surface Temperature data in Figures 9 and 10 is available from the GISS Stratospheric Aerosol Optical Thickness webpage here.


Pingback: On Foster and Rahmstorf 2011 – Global temperature evolution 1979–2010 | Bob Tisdale – Climate Observations
One useful aspect of posting on the web is the timeliness. Because of technology and geography my link was not broadband before September of 2008. Since that time I have read more than a few (30 +/- ?) posts by Bob T. (at WUWT and on his own ( https://bobtisdale.wordpress.com/ ) site. I’ve also followed many links at his suggestion – some are mentioned (again) in this post. If I were still relying for subscriptions or the local university library for my science-reading I might – just now – be reading my first Bob T. ‘peer’ reviewed article. Okay, that may be a bit of an exaggeration.
The main points of this posting seem to be that ENSO is a process not represented by the index used to identify it, and La Niña events are not the opposite of El Niño events. A third point, I guess, is that other researchers either do not understand, or do not wish to acknowledge these things.
Can anyone show these two concepts to be incorrect?
After 3.5 years of reading about this it seems to me, Bob T. just keeps making in cleaner and clearer.
Ditto!
PS: Don’t know why it’s true but it is, we learn more when we make a faux pas than when we don’t. Who knew?
Excellent as always Bob. It must be very frustrating when the obvious facts of ENSO and it’s impact on SST that you constantly highlight are constantly ignored or rejected by IPCC linked climate scientists. Please do not stop your quest until you also become a source of stored carbon. You have many supporters !
Pingback: An Unsent Memo to James Hansen | Bob Tisdale – Climate Observations
Pingback: Tisdale: An Unsent Memo to James Hansen | Watts Up With That?
Pingback: On Dana1981’s Meaningless ENSO Exercise at SkepticalScience | Bob Tisdale - Climate Observations
Pingback: On Dana1981’s Meaningless ENSO Exercise at SkepticalScience | Watts Up With That?
Pingback: Tisdale takes on Tamino’s Foster & Rahmstorf 2011 | Watts Up With That?
Pingback: Comments on Stefan Rahmstorf’s Post at RealClimate “What ocean heating reveals about global warming” | Bob Tisdale – Climate Observations
Pingback: Comments on Stefan Rahmstorf’s Post at RealClimate “What ocean heating reveals about global warming” | Watts Up With That?
Pingback: Trenberth and Fasullo Try to Keep the Fantasy Alive | Bob Tisdale – Climate Observations
Pingback: Trenberth and Fasullo Try to Keep the Fantasy Alive | Watts Up With That?
Pingback: An Odd Mix of Reality and Misinformation from the Climate Science Community on England et al. (2014) | Bob Tisdale – Climate Observations
Pingback: An Odd Mix of Reality and Misinformation from the Climate Science Community on England et al. (2014) | Watts Up With That?
Pingback: Yet Even More Nonsense from Grant Foster (Tamino) et al. on the Bias Adjustments in the New NOAA Pause-Buster Sea Surface Temperature Dataset | Bob Tisdale – Climate Observations
Pingback: Yet Even More Nonsense from Grant Foster (Tamino) et al. on the Bias Adjustments in the New NOAA Pause-Buster Sea Surface Temperature Dataset | Watts Up With That?