
…A Few Model-Data Comparisons of Greenland Surface Air Temperatures
Mass losses from Greenland’s ice sheets have been one of the focuses of alarmists for decades. In fact, last week, U.S. Secretary of State John Kerry visited Greenland on a (boreal) summertime tour of parts of Greenland in an apparent political publicity stunt. See The Washington Post article John Kerry just visited the most stunning example of our changing climate by Chris Mooney. It’s chock full of alarmist babble. Great for a laugh. Why a laugh? Read on.
One of the principal contributing factors to the losses of Greenland’s ice sheets is surface temperature. So we’ll focus this model-data comparison on the surface air temperatures of Greenland. And speculation from the climate science community about Greenland surface temperatures and their impacts on ice sheet mass loss there and the contribution of those losses to sea level rise are based on climate models. As you’ll see, the consensus of the climate models used by the IPCC show the models cannot simulate Greenland’s surface temperatures over any timeframe from 1861 to present. Why then do people believe the model-based speculations about the future of Greenland surface temperatures, ice sheet losses and global sea levels? Because John Kerry wasted taxpayer dollars on a fossil-fuel-consuming trip to Greenland and then tweeted about it?
INTRODUCTION
We illustrated and discussed the wide ranges of modeled and observed absolute global surface temperatures in the November 2014 post On the Elusive Absolute Global Mean Surface Temperature – A Model-Data Comparison. Not long after came a post at RealClimate of modeled absolute global surface temperatures, authored by Gavin Schmidt, the head of the Goddard Institute of Space Studies (GISS). Gavin’s post is Absolute temperatures and relative anomalies. (Please read it in its entirety. I believe you’ll find it interesting.) Of course, Gavin Schmidt was downplaying the need for climate models to simulate Earth’s absolute surface temperatures.
In this post about Greenland’s surface temperatures, we’ll present a few examples of why climate modelers need to shift their focus from surface temperature anomalies to absolute surface temperatures. But the problems are much greater than that, as you’ll see.
In the past, we’ve compared models and data using time-series graphs of temperature anomalies, absolute temperatures and temperature trends, and we’ll continue to provide them in this post. But to help illustrate why absolute temperatures are important, we’re adding a new model-data comparison graph: annual cycles based on the most-recent recent multidecadal period. Don’t worry, that last part will become clearer later in the post.
MODELS AND DATA
We’re using the model-mean of the climate models stored in the CMIP5 (Coupled Model Intercomparison Project Phase 5) archive, with historic forcings through 2005 and RCP8.5 forcings thereafter. (The individual climate model outputs and model mean are available through the KNMI Climate Explorer.) The CMIP5-archived models were used by the IPCC for their 5th Assessment Report. The RCP8.5 forcings are the worst-case future scenario.
We’re using the model-mean (the average of the climate model outputs) because the model-mean represents the consensus of the modeling groups for how surface temperatures should warm if they were warmed by the forcings that drive the models. See the post On the Use of the Multi-Model Mean for a further discussion of its use in model-data comparisons.
I’ve used the ocean-masking feature of the KNMI Climate Explorer and the coordinates of 60N-85N, 75W-10W to capture the modeled near-land surface air temperatures of Greenland.
Surface air temperature data for Greenland are available from the Berkeley Earth website, specifically the Greenland data here. While the monthly data are presented in anomaly form (referenced to the period of 1951-1980), Berkeley Earth also provides the monthly values of their climatology in absolute terms, which we then simply add to the anomalies of the respective months to determine the absolute monthly values. Most of the graphs, however, are based on annual average values to reduce the volatility of the data.
The model mean of surface temperatures at the KNMI Climate Explorer starts in 1861 and the Berkeley Earth data end in August 2013, so the annual data in this post run from 1861 to 2012.
ANNUAL NEAR-LAND SURFACE AIR TEMPERATURES – GREENLAND
Figure 1 includes the modeled and observed annual near-land surface air temperature anomalies for Greenland from 1861 to 2012. Other than slightly underestimating the long-term warming trend, the models do a horrible job of simulating the warming (and cooling) of Greenland’s surfaces…horrible seems to be too weak a word to describe how poorly the models simulate the surface air temperatures of Greenland. The consensus of the models misses the early multidecadal warming that caused Greenland surface temperature anomalies to rise well above a zero anomaly in the late-1920s through the late-1940s. Because the models fail to simulate that early warming, they fail to capture the cooling that lasted until the late-1980s/early-1990s. And because the models fail to capture that long-term cooling, they underestimate the recent warming.

Figure 1
Figure 2 compares the modeled and observed temperatures on an absolute basis. Not only do the models miss the multidecadal variations in Greenland’s surface temperature, the consensus of the models is running too cold. That of course would impact how well the models simulate ice-sheet mass losses there. More on that later.

Figure 2
THE MODELS ARE PRESENTLY SIMULATING PAST TEMPERATURE-BASED CLIMATE IN GREENLAND, NOT THE CURRENT CLIMATE
Climate is typically defined as the average conditions over a 30-year period. So for Figure 3, I’ve smoothed the data and model outputs in absolute form with a 30-year running-mean filter, centered on the 15th year.
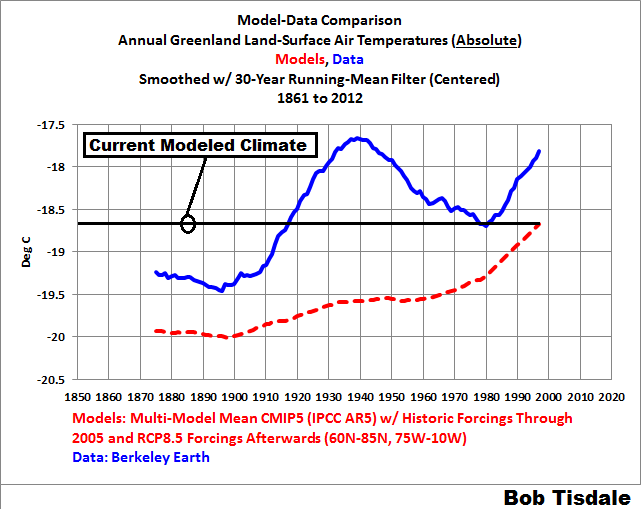
Figure 3
The models obviously fail to properly simulate the observed surface temperatures for Greenland and their multidecadal variability. As a result, the most recent modeled 30-year temperature-based climate is comparable to the 30-year temperatures observed in Greenland centered about 18 years ago…and centered about 8 decades ago. In fact, the present modeled 30-year values are far below the 30-year temperatures centered on about 1940. Considering how poorly climate models simulate Greenland’s surface air temperatures, how then could the modelers ever hope to be able to simulate the contributions to sea level rise of the Greenland ice sheet loss in the past and in the present…and the future? They can’t. What they’re presenting to us is nothing more than science fiction.
30-YEAR RUNNING TRENDS SHOW THAT THERE IS NOTHING UNUSUAL ABOUT GREENLAND’S MOST RECENT RATE OF WARMING
Figure 4 shows the modeled and observed 30-year trends (warming and cooling rates) of Greenland’s surface air temperatures. If trend graphs are new to you, I’ll explain. First, note the units of the y-axis. They’re deg C/decade, not deg C. The last data points show the 30-year observed and modeled warming rates from 1983 to 2012, and it’s shown at 2012 (thus the use of the word trailing in the title block). The data points immediately before it at 2011 show the trends from 1982 to 2011. That running of 30-year trends continues back in time until the first data point at 1890, which captures the observed and modeled slight cooling rates from 1861 to 1890.
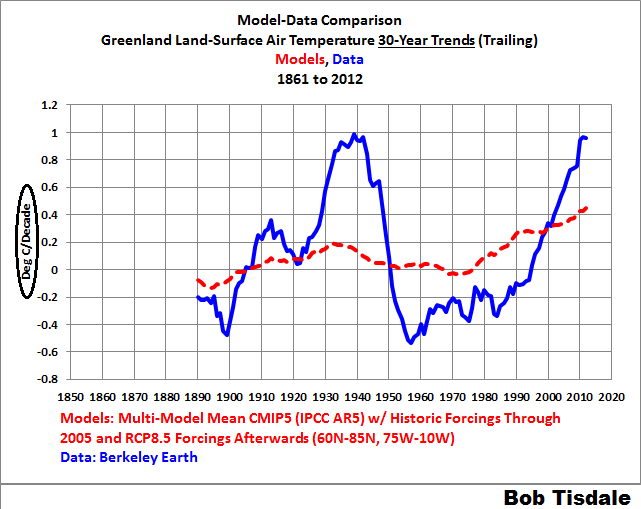
Figure 4
A few things stand out in Figure 4. First, the observed 30-year warming rates ending in the late-1930s, early-1940s are comparable to the most recent 30-year trends. In other words, there’s nothing unusual about the most recent 30-year warming rates of Greenland surface air temperatures. Nothing unusual at all.
Second, notice the disparity in the warming rates of the models and data for the 30-year period ending about 1940. According to the consensus of the models, Greenland’s surface air temperatures should only have warmed at a rate of (less than) 0.2 deg C/decade over that 30-year period…if the warming there was dictated by the forcings that drive the models. But the data indicate Greenland’s surface temperatures warmed at a rate that was almost 1.0 deg C/decade during the 30-year period ending about 1940…more than 5-times higher than the consensus of the models. That additional 30-year warming observed in Greenland, above and beyond that shown by the consensus of the models, logically had to come from somewhere. If it wasn’t due to the forcings that drive the models, then it likely resulted from natural variability…with the Atlantic Multidecadal Oscillation and polar amplification being the likely causes.
Note: For those new to the Atlantic Multidecadal Oscillation, see Chapter 3.3 of my free ebook On Global Warming and the Illusion of Control – Part 1 (25MB .pdf). And for readers new to polar amplification, see Chapter 1.18. As you’ll discover, climate models do not properly simulate the naturally occurring phenomena known as the Atlantic Multidecadal Oscillation or polar amplification. [End note.]
Third thing to note about Figure 4: As noted earlier, the observed warming rates for the 30-year periods ending in 2012 and 1940 are comparable. But the consensus of the models show, if Greenland’s surface air temperatures were dictated by the forcings that drive the models, the warming rate for the 30-year period ending in 2012 should have been noticeably higher than the 30-year period ending about 1940…more than twice as high. Yet the data show that did not happen.
Fourth: The fact that the models better simulate the warming rate observed during the later warming period is of little value. The model consensus and data indicate that Greenland’s surface temperatures can warm naturally at rates that are more than 5 times higher than shown by the consensus of the models.
ANNUAL CYCLES
Let’s add insult to injury. The top graph in Figure 5 compares the modeled and observed average annual cycles of Greenland’s surface temperatures for the most recent 30-year period (1983 to 2012). Over that period, data indicate that Greenland’s average surface temperatures varied from about -30 deg C in January to roughly -1.2 deg C in July. On the other hand, the consensus of the models show they appear to do well over parts of the year but come up short (by about 2 deg C ) at the critical peak temperatures in June, July and August.
You might be saying to yourself, it’s only 2 deg C.
But if we run the modeled annual cycle ahead in time, the bottom graph in Figure 5, we can see that the models do not come close to achieving the observed (1983-2012) annual peak temperatures in Greenland until the 30-year period of 2031-2060, more than 4 decades from now.
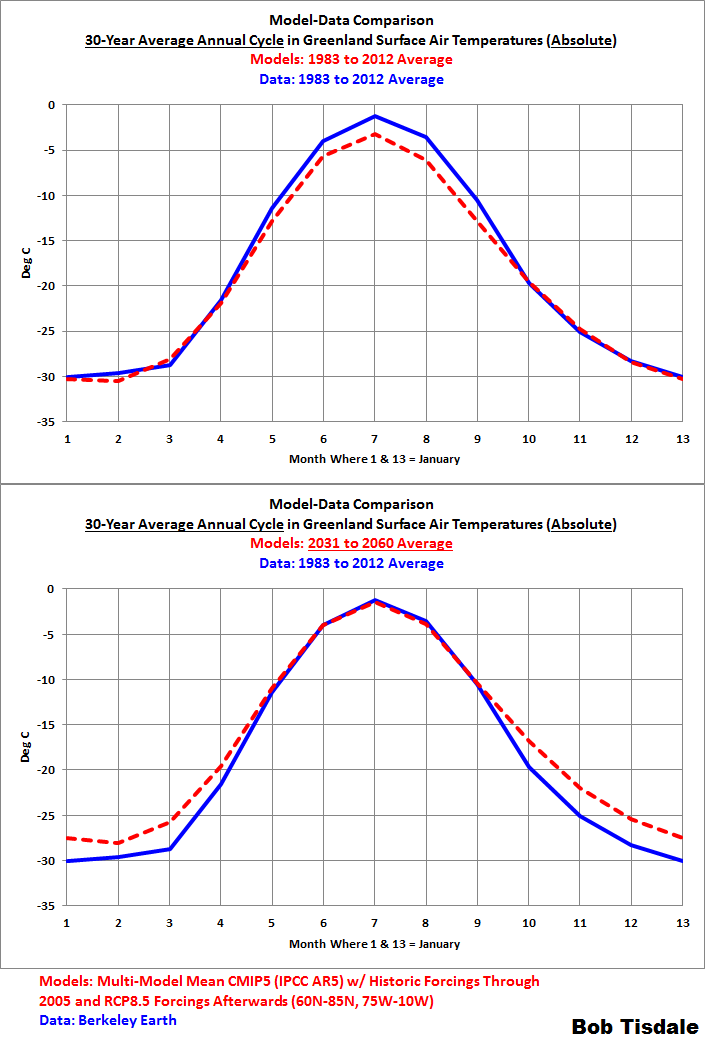
Figure 5
We could never have shown that climate model failing using temperature anomalies.
CLOSING
Climate science is a model-based science, inasmuch as climate models are used by the climate science community to speculate about the contributions of manmade greenhouse gases to past, present and future global warming and climate change.
The climate models used by the Intergovernmental Panel on Climate Change) IPCC cannot properly simulate Greenland’s surface air temperatures over any timeframe from 1861 to present. Basically, they have no value as tools for use in determining how surface temperatures have impacted ice sheet mass loss in the past or how they may be impacting those losses presently or how they may impact them in the future. That also draws into question any speculation about past, present and future contributions of the Greenland ice sheet losses to sea level rise.
As noted a few times in On Global Warming and the Illusion of Control – Part 1, climate models are presently not fit for the purposes for which they were intended.


robin and i also used actual temp measurements and here is what we found
http://papers.ssrn.com/sol3/papers.cfm?abstract_id=2776867
You’re “spot on” as climate models used for policy decisions “…have no value as tools for use in determining … past, present and future contributions of the Greenland ice sheet losses to sea level rise.” What is worse is that the stunning acceleration of Atmospheric CO2 since the 1800s generates NO signal in the steady, linear, non-accelerating, methodical rise in sea level as measured by Tide Gauges in tectonically inert places. The impact of CO2 isn’t just minimal, it just DOESN’T EXIST!!!
An even more definitive indictment,
The Bottom Line About “Climate Science” and “Global Warming”
not just of the models, but the “global temperature” records themselves.
If the surface of Greenland is supposed to be melting, it is interesting to speculate how the P-38 Lightning now rescued, rebuilt and renamed “Glacier Girl” managed to end up under 268 feet of ice in 50 years – some 5.36 feet per year.
http://p38assn.org/glaciergirl/recovery.htm
Reblogged this on ClimateTheTruth.com.
Pingback: Hurricane Main Development Region of North Atlantic – Climate Model-Simulated Sea Surface Temperatures Are Too Cool | Bob Tisdale – Climate Observations
Pingback: Hurricane Main Development Region of North Atlantic – Climate Model-Simulated Sea Surface Temperatures Are Too Cool | Watts Up With That?
Pingback: In Honor of the 4th of July, A Few Model-Data Comparisons of Contiguous U.S. Surface Air Temperatures | Bob Tisdale – Climate Observations
Pingback: In Honor of the 4th of July, A Few Model-Data Comparisons of Contiguous U.S. Surface Air Temperatures | Watts Up With That?