
In addition to the WattsUpWithThat cross post, a number of other blogs cross posted (in part or in whole) or reblogged my recent post Sea Surface Temperature Anomalies along Sandy’s Track Haven’t Warmed in 70+ Years. An anonymous blogger at one accused me of cherry-picking, which is curious since there was 70+ years of data and I noted in the post that I had used 1938 as the start year because that was the year of the Great New England Hurricane—also known as the Yankee Clipper, Long Island Express, or the Great Hurricane.
Maybe that blogger assumed I had purposely ended the data in August 2012 to hide a recent warming, and that another two months of data would have a significant impact on the trends. Truth be told, I used my preferred long-term, infilled sea surface temperature dataset, HADISST, in that post and the Hadley Centre is a bit slow in updating it. In other words, HADISST updates lag by a few months. In the past few days, however, NOAA has updated its ERSST.v3b data through October 2012. So let’s take a look at the monthly sea surface temperature anomalies and the October sea surface temperatures from 1938 to 2012. They will confirm that the sea surface temperatures in October 2012 were not unusually warm along Sandy’s storm track.
Refer to the map herefor the coordinates used.
FULL PATH
The NOAA ERSST.v3b-based monthly sea surface temperature anomalies for the entire storm track (12N-40N, 80W-70W), from January 1938 to October 2012 are shown in Figure 1. The horizontal red line is the October 2012 sea surface temperature anomaly, and the blue line is the linear trend calculated by EXCEL. The linear trend is basically flat, meaning sea surface temperature anomalies along Sandy’s path haven’t warmed in 70+ years based on the trend, and that confirms the results of the earlier post. Notice also, as far back as 1939, there were a good number of times when sea surface temperature anomalies for the entire storm track were warmer than the October 2012 value.
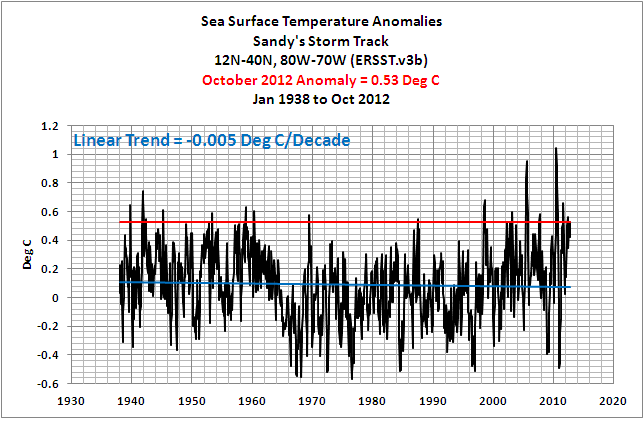
Figure 1
Figure 2 presents the October sea surface temperatures (not anomalies) from 1938 to 2012 for Sandy’s entire storm track. Working back in time, sea surface temperatures in 2007, 2005 and 1939 were warmer than they were in 2012, while in 2002, 1957, 1952 and 1941 sea surface temperatures were comparable to those in 2012. That is, the October 2012 sea surface temperatures along Sandy’s storm track were NOT unusually warm.

Figure 2
EXTRATROPICAL PATH
The monthly sea surface temperature anomalies north of 24N along Sandy’s track show a long-term cooling, based on the linear trend. See Figure 3. Sea surface temperature anomalies that are warmer than the October 2012 value are common, especially during the 1940s and 1950s.

Figure 3
It also appears there was a downward shift in the 1960s. Smoothing the data with a 13-month running-average filter and adding period-average temperature anomalies before and after the 1960s, Figure 4, help to show the shift—one that cooled sea surface temperature anomalies by about 0.28 deg C in this region during the 1960s.

Figure 4
CLOSING
The October sea surface temperatures from 1938 to 2012 for the extratropical portion of Sandy’s storm track (24N-40N, 80W-70W) show a long-term cooling trend until the late 1990s followed by a very obvious upward shift. See Figure 5. Hopefully, after I’m done preparing my presentation for the upcoming WUWT-TV special, I’ll see if the upward shift was caused by a change in the North Atlantic Oscillation (a sea level pressure index, which reflects changes in North Atlantic wind patterns). It also shows that October sea surface temperatures for the extratropical portion of Sandy’s track were warmer numerous times over the past 70+ years, with most occurring during the 1940s and 50s.

Figure 5
One thing’s for sure, there does not appear to be an anthropogenic global warming signal in any of the sea surface temperature or temperature anomaly graphs presented in this post.
But there’s nothing special about that, because…
…SATELLITE-ERA SEA SURFACE TEMPERATURE DATA CONTRADICTS THE MANMADE GLOBAL WARMING HYPOTHESIS
I was quite pleased over the past few days. Sales of my recently published ebook were very strong with my post Sea Surface Temperature Anomalies along Sandy’s Track Haven’t Warmed in 70+ Years. Thanks to all who’ve bought a copy. If you haven’t purchased one yet, maybe today’s post might prompt you to take a look.
The satellite-era sea surface temperature records indicate El Niño and La Niña events are the primary causes of the warming of global sea surface temperature anomalies over the past 30 years, not manmade greenhouse gases. I’ve searched sea surface temperature records for more than 4 years, and I can find no evidence of an anthropogenic greenhouse gas signal. That is, the warming of the global oceans has been caused by Mother Nature, not anthropogenic greenhouse gases.
I’ve recently published an e-book (pdf) about the phenomena called El Niño and La Niña. It’s titled Who Turned on the Heat? with the subtitle The Unsuspected Global Warming Culprit, El Niño Southern Oscillation. It is intended for persons (with or without technical backgrounds) interested in learning about El Niño and La Niña events and in understanding the natural causes of the warming of our global oceans for the past 30 years. Because land surface air temperatures simply exaggerate the natural warming of the global oceans over annual and multidecadal time periods, the vast majority of the warming taking place on land is natural as well. The book is the product of years of research of the satellite-era sea surface temperature data that’s available to the public via the internet. It presents how the data accounts for its warming—and there are no indications the warming was caused by manmade greenhouse gases. None at all. The same holds true for Ocean Heat Content data. The warming of the global oceans to 700 meters since 1955 can also be easily explained through natural variables.
Who Turned on the Heat? was introduced in the blog post Everything You Every Wanted to Know about El Niño and La Niña… …Well Just about Everything. The Updated Free Previewincludes the Table of Contents; the Introduction; the beginning of Section 1, with the cartoon-like illustrations; the discussion About the Cover; and the Closing.
Please buy a copy. (Credit/Debit Card through PayPal—you do NOT need to open a PayPal account). It’s only US$8.00.
You’re probably asking yourself why you should spend $8.00 for a book written by an independent climate researcher. First, there aren’t many independent researchers investigating El Niño-Southern Oscillation or its long-term impacts on global surface temperatures. In fact, if you were to perform a Google image search of NINO3.4 sea surface temperature anomalies, the vast majority of the graphs and images are from my blog posts. Try it. Cut and paste NINO3.4 sea surface temperature anomaliesinto Google. Click over to images and start counting the number of times you see Bob Tisdale.
Second, by independent I mean I am not employed in a research or academic position; I’m not obligated to publish results that encourage future funding for my research—that is, my research is not agenda-driven. I’m a retiree, a pensioner. The only funding I receive is from book sales and donationsat my blog. Also, I’m independent inasmuch as I’m not tied to consensus opinions so that my findings will pass through the gauntlet of peer-review gatekeepers. Truth be told, it’s unlikely the results of my research would pass through that gauntlet because the satellite-era sea surface temperature data contradicts the tenets of the consensus.
SOURCE
The Sea Surface Temperature anomaly data used in this post is available through the KNMI Climate Explorer website.


Living in Florida one gets used to monitoring the SST not that I am convinced there is a direct causal relationship with hurricanes but cooler normally means less of them. From the Unisys anomaly charts ( http://weather.unisys.com/surface/sst_anom_new.gif ) there appear to be a few warmish patches along the eastern seaboard. However, I really hope that northern Europe is not expecting a warm Gulf Stream/North Atlantic Drift as the waters around Florida that source the current have suddenly gone very cold. The manatees have noticed and have already started crowding into warm water springs months earlier than normal. It looks like someone has turned the heat off down here.
Ian: Were the manatees crowding around the warm springs before or after Sandy?
Pingback: The Impact of Sandy on Sea Surface Temperature Anomalies Along Its Track | Bob Tisdale – Climate Observations
Pingback: Inverse hockey stick – Hurricane Sandy cools the ocean | Watts Up With That?
Pingback: Blog Memo to John Hockenberry Regarding PBS Report “Climate of Doubt” | Bob Tisdale – Climate Observations
Pingback: Blog Memo to John Hockenberry Regarding PBS Report “Climate of Doubt” | Watts Up With That?
Pingback: Video: The Impact of Manmade Global Warming on a Blizzard Called Nemo and on Hurricane Sandy | Bob Tisdale – Climate Observations
Pingback: New video from Bob Tisdale explains The Impact of Manmade Global Warming on a Blizzard Called Nemo and on Hurricane Sandy | Watts Up With That?
Pingback: Blog Memo to Lead Authors of NCADAC Climate Assessment Report | Bob Tisdale – Climate Observations
Pingback: Blog Memo to Lead Authors of NCADAC Climate Assessment Report | Watts Up With That?
Pingback: Joe Romm Predicts “…All But Certain Ruin for Modern Civilization…” from a NOAA Fisheries Press Release | Bob Tisdale – Climate Observations
Pingback: Joe Romm Predicts “…All But Certain Ruin for Modern Civilization…” from a NOAA Fisheries Press Release | Watts Up With That?
Pingback: Hurricane Main Development Region Sea Surface Temperatures & Anomalies – Plus a Couple of Other Regions | Bob Tisdale – Climate Observations
Pingback: Hurricane Main Development Region Sea Surface Temperatures & Anomalies – Plus a Couple of Other Regions | Watts Up With That?
Pingback: A Couple of Comments about the Oppenheimer and Trenberth Washington Post Op-Ed | Bob Tisdale – Climate Observations
Pingback: A Couple of Comments about the Oppenheimer and Trenberth Op-Ed in the Washington Post | Watts Up With That?
Pingback: Mid-July 2013 Hurricane Development Region Sea Surface Temperature Anomalies | Bob Tisdale – Climate Observations
Pingback: Mid-July 2013 Hurricane Development Region Sea Surface Temperature Anomalies | Watts Up With That?
Pingback: Mid-August Hurricane Development Region Sea Surface Temperature Anomaly Update | Bob Tisdale – Climate Observations
Pingback: Mid-August Hurricane Development Region Sea Surface Temperature Anomaly Update | Watts Up With That?
Pingback: Open Letter to the Executive Producers of YEARS of LIVING DANGEROUSLY | Bob Tisdale – Climate Observations
Pingback: Open Letter to the Executive Producers of YEARS of LIVING DANGEROUSLY | Watts Up With That?
Pingback: Hurricane Development Region Sea Surface Temperature Anomalies as We Start the 2014 Season | Bob Tisdale – Climate Observations
Pingback: Hurricane Development Region Sea Surface Temperature Anomalies as We Start the 2014 Season | Watts Up With That?
Pingback: Tropical Storm Arthur – There Is Nothing Unusual About the Sea Surface Temperatures Off the East Coast of the U.S. | Bob Tisdale – Climate Observations
Pingback: Tropical Storm Arthur – There Is Nothing Unusual About the Sea Surface Temperatures Off the East Coast of the U.S. | Watts Up With That?
Pingback: Recent Hawaiian Tropical Cyclones – Sea Surface Temperature Anomalies of the Storm Tracks | Bob Tisdale – Climate Observations
Pingback: Recent Hawaiian Tropical Cyclones – Sea Surface Temperature Anomalies of the Storm Tracks | Watts Up With That?
Pingback: Hurricane Development Region Sea Surface Temperature Update – August 2014 | Bob Tisdale – Climate Observations
Pingback: Hurricane Development Region Sea Surface Temperature Update – August 2014 | Watts Up With That?
Pingback: A Preliminary Look at the Sea Surface Temperature Anomalies Since 1940 along Hurricane Joaquin’s Forecasted Storm Track | Bob Tisdale – Climate Observations
Pingback: A Preliminary Look at the Sea Surface Temperature Anomalies Since 1940 along Hurricane Joaquin’s Forecasted Storm Track | Watts Up With That?