
I knew it wouldn’t take long. The 2014/15 El Niño has yet to form and there’s already a well-commented blog post about it that spreads more speculative nonsense than one would think possible. Even the title Monster El Nino Emerging From the Depths: Nose of Massive Kelvin Wave Breaks Surface in Eastern Pacific is remarkable. (H/T to Ric Werme.) The article was written by Robert Scribbler, who appears to be fiction novelist Robert Marston Fanney. It seems appropriate since that blog post is filled with fiction. Robert has a follow-up post this week El Nino Update: Monster Kelvin Wave Continues to Emerge and Intensify. It appears as though the author, who has little understanding of El Niño processes, or how the data are presented, or the history of ENSO events, is trying to suck in some blog traffic from persons with even less knowledge.
Since Robert is a storyteller, let’s tell the tale of the data.
NOTHING IN THE INSTRUMENT TEMPERATURE RECORD INDICATES ANTHROPOGENIC GLOBAL WARMING HAS HAD ANY IMPACT ON THE SEA SURFACE TEMPERATURES OF THE TROPICAL PACIFIC IN 32+ YEARS
El Niño events take place in the tropical Pacific. Figure 1 is a model-data comparison of the sea surface temperature anomalies of the tropical Pacific since the start of the Reynolds OI.v2 satellite-enhanced sea surface temperature dataset in November 1981. The models are represented by the multi-model ensemble-member mean of the climate models stored in the CMIP5 archive, which was used by the IPCC for their 5th assessment report. (Figure 1 is from the post Maybe the IPCC’s Modelers Should Try to Simulate Earth’s Oceans. See that post for further information.) According to the most current generation of climate models—the latest and greatest climate models—if manmade greenhouse gases warmed the sea surface temperatures of the tropical Pacific, they should have warmed about 0.58 deg C over the past 32+ years, based on the linear trend. But the observed sea surface temperatures of the tropical Pacific show little warming in 32+ years.

Figure 1
Let’s look at a few subsurface temperature-related datasets, since much of the fuel for an El Niño comes from below the surface. Because Robert used the phrases “extraordinarily powerful”, “global warming riled monster”, “hot water pool had grown into a vast abyss of heat”, and “may be hotter and stronger than even the record-shattering 1997-98 El Niño”, we’ll compare the starting point of this El Niño to the start of the 1997/98 El Niño.
Many persons have been wondering how the background for this El Niño compares to the benchmark of El Niños, the 1997/98 super El Niño, so this is a logical post to show it.
OCEAN HEAT CONTENT FOR THE TROPICAL PACIFIC IS LOWER NOW THAN IT WAS BEFORE THE 1997/98 EL NIÑO
The NODC’s ocean heat content data are available through the KNMI Climate Explorer for the depths of 0-700 meters, and that’s deep enough as the vast majority of the ENSO-related subsurface processes take place in the top 300 meters. We’ve also shown in the past that the source data for the depths of 0-700 meters and 0-2000 meters in the tropical Pacific are exactly the same (see the graph here, from the postAn Odd Mix of Reality and Misinformation from the Climate Science Community on England et al. (2014)), so there can be no speculation that maybe the heat is hiding below the depths of 700 meters in the tropical Pacific.
The NODC has not yet published its ocean heat content data for the 1st quarter of 2014. So for the ocean heat content data for the tropical Pacific, we’ll have to compare the October-December 2013 value to the October-December 1996 value. See Figure 2. The ocean heat content for the tropical Pacific (24S-24N, 120E-80W) in the last quarter of 2013 is considerably less than it was in the last quarter of 1996, leading up to the 1997/98 El Niño.

Figure 2
In the western tropical Pacific (24S-24N, 120E-180), which captures the West Pacific Warm Pool, the October-December 2013 value is much closer to the October-December 1996 value, but it doesn’t exceed it. See Figure 3.
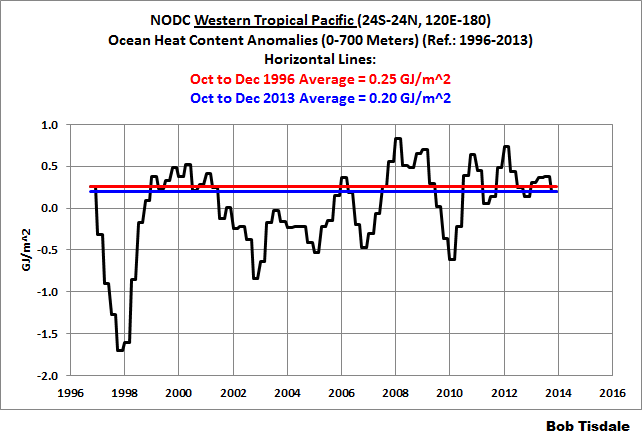
Figure 3
And that means the warm water for this El Niño has been flooding into a much cooler eastern tropical Pacific (24S-24N, 180-80W) as shown in Figure 4. Will that have an impact? We’ll have to watch and see.

Figure 4
It’s tough to claim that manmade greenhouse gases are responsible for the warm water associated with this El Niño, when the ocean heat content of the tropical Pacific is lower now than it was before the 1997/98 El Niño.
But El Niño events are focused along the equator in the Pacific. So let’s look at the TAO Project H300 data, which represents the average subsurface temperature anomalies for the top 300 meters of the equatorial Pacific.
SUBSURFACE TEMPERATURES FOR THE EQUATORIAL PACIFIC ARE LOWER NOW THAN THEY WERE BEFORE THE 1997/98 EL NIÑO
The Tropical Ocean-Atmosphere (TAO) Project H300 (depth-averaged temperature for the top 300 meters) data for the equatorial Pacific are broken down into eastern and western subsets, divided at 155W. For the western equatorial Pacific (5S-5N, 120E-155W), the data are here, and for the eastern equatorial Pacific (5S-5N, 155W-85W), they are here.
Curiously, the most recent monthly data are for April 2014, so I suspect the data are listed for the previous month, or maybe the April 2014 data are for the month-to-date. Regardless, in Figures 5 and 6, I’ve highlighted the January to April 1997 data in orange, and the January to April 2014 data in light blue. The average subsurface temperatures for the January to April 1997 are presented as the red horizontal lines and the average subsurface temperatures for the January to April 2014 are presented as the dark blue horizontal lines. In both the eastern and the western equatorial Pacific, according to the TAO project buoys, the subsurface temperature anomalies for the first 4 months of 2014 are lower than they were for the first 4 months of 1997.

Figure 5
# # #

Figure 6
So much for unprecedented nonsense.
COULD SEA SURFACE TEMPERATURE ANOMALIES IN THE EASTERN EQUATORIAL PACIFIC FOR THE 2014/15 EL NIÑO REACH 5 TO 6 DEG C?
I don’t believe I’ve ever seen a blog post written with more unfounded speculation than Robert’s Monster El Nino Emerging From the Depths: Nose of Massive Kelvin Wave Breaks Surface in Eastern Pacific. So far, we’ve shown that most of his post can be dismissed as nonsense. But, after ending a discussion of the sea surface temperatures of the eastern equatorial Pacific, he closes his post with:
Should the rest of the Kelvin wave follow, temperature anomalies in this region will spike well above 4 C and possibly has high as 5-6 C. Such an event would be even stronger than the one seen in 1997-98, drive global temperatures about .05 to .2 C hotter than previous records in a single year, and set off a series of extreme weather that, when combined with the already severe conditions set in place by human-caused warming, may well be far in excess of those seen during past events.
Can an El Niño produce sea surface temperatures in excess of 5 deg C in the eastern equatorial Pacific? Yup. Would it be unprecedented? Nope. It happened during the peak of the 1997/98 El Niño, contradicting Robert’s speculation.
Animation 1 presents weekly sea surface temperature anomalies, for the eastern tropical Pacific, from the first week of September 1997 through the last week of January 1998. It captures the impact of the peak of the 1997/98 El Niño. As shown, the sea surface temperatures west of the Galapagos Islands reached anomalies in the 5.0 to 6.0 deg C range.

Animation 1
The maps are available through the NOAA NOMADS website. Figure 7 is the map for one of the peak weeks, November 26, 1997.

Figure 7
According to the TAO Project’s U-component (east-west) wind data, which are based on measurements from the weather stations atop the TAO buoys, in 1997 the trade winds in the western tropical Pacific (normally easterlies) had changed to westerlies a number of times and at varying strengths throughout the year. See Figure 8. (The TAO Project U- & V-component wind data are also available through the KNMI Climate Explorer.)

Figure 8
This caused the equatorial countercurrent to engorge, pumping more warm water from the west Pacific Warm Pool into the eastern equatorial Pacific. (See the post Equatorial Currents Before, During, and After The 1997/98 El Nino.) Basically, warm water that is normally in the western equatorial Pacific had been transported as far east as the Galapagos. Figure 9 uses the Reynolds OI.v2 sea surface temperature climatology for the week of November 26, 1997 as a reference. The anomalies in Figure 7 are based on the climatology shown in Figure 9.

Figure 9
Only time will tell how strong the westerlies will become during this El Niño and how long they will persist…and how much warm surface water they will push to the east.
Over the next few months, I suspect they’ll be news articles that include interviews of with oceanographers who specialize in El Niño events. Those oceanographers will be mentioning that it’s a little early to tell how strong the El Niño will become, because much will depend on what the trade winds decide to do. The question isn’t whether they’ll reverse in the western equatorial Pacific. It’s how strong the westerlies will become and how long they will last.
ONE LAST NOTE
In Figure 1, we showed that the sea surface temperatures of the tropical Pacific haven’t warmed in 32+ years, while the climate models showed they should have warmed considerably. Just in case you’re new here, see Figure 10. The sea surface temperatures of the entire East Pacific Ocean, from pole to pole (90S-90, 180-80W) also show little to no warming for the entire duration of the satellite-enhanced Reynolds OI.v2 sea surface temperature data. And once again, the climate models show that, if the surface of the East Pacific Ocean were warmed by manmade greenhouse gases, the sea surface temperatures there would have warmed about 0.48 deg C. Now, the East Pacific is not a small subset. Based on the coordinates used, the East Pacific data covers about 33% of the surface of the global oceans. Again please see the post Maybe the IPCC’s Modelers Should Try to Simulate Earth’s Oceans.

Figure 10
CLOSING
You really should spend a few moments to read Robert’s posts and his comments on those threads. I have never read so much unfounded conjecture in any post about El Niño events. Never. For that, we’ll have to call on Dr. Roger Pielke Jr.’s handy buttonfor RobertScribbler’s two posts about El Niño. I suspect there will be more, since he appears to really enjoy writing about the upcoming El Niño, a subject he clearly does not comprehend.

Pielke Jr. BS Button
The very sad part: Based on the comments on the threads of Robert’s posts, there are people who believe his nonsense.
FURTHER READING
The first post in this series is The 2014/15 El Niño – Part 1 – The Initial Processes of the El Niño.
Portions of this post should help to confirm the processes of El Niño discussed in An Illustrated Introduction to the Basic Processes that Drive El Niño and La Niña Events.
I went into much more detail to explain ENSO processes and the aftereffects of El Niño and La Niña events in my ebook Who Turned on the Heat? I’ve lowered the price of Who Turned on the Heat? from U.S.$8.00 to U.S.$5.00…with hope of increasing sales a little bit. A free preview in pdf format is here. The preview includes the Table of Contents, the Introduction, the first half of section 1 (which was provided complete in this post), a discussion of the cover, and the Closing. Take a run through the Table of Contents. It is a very-detailed and well-illustrated book—using data from the real world, not models of a virtual world. Who Turned on the Heat? is only available in pdf format…and will only be available in that format. Click here to purchase a copy. Thanks.


Once again, Bob, thanks for the clear and well funded explanation. Facts trump fiction, anytime,
It is really amusing to watch the Warmists cheerleading for a Super-El. This is a De Facto admission that global temperatures are predominantly modulated by the oceans, contradicting the basic premise in the AGW theory.
Your figures 2,3,4,5, and 6 show a lower Ocean heat content after an El Nino. The difference is considerable in some of the stronger El Ninos; especially as show in figure 2 for the 97-98 El Nino. This says that some of the heat is from the deep Ocean, instead of purely Solar heating. I can’t figure out how all the pieces go together; but, I believe that calcium carbonate hexahydrate is part of the process.
Retired Engineer John says: “Your figures 2,3,4,5, and 6 show a lower Ocean heat content after an El Nino…”
Correct.
Let’s concentrate on Figure 2 so that we don’t have to consider the warm water sloshing back and forth. Ocean heat content decreases during an El Nino because the tropical Pacific is releasing heat to the atmosphere, primarily through evaporation. Keep in mind that the absolute surface temperature of the tropical Pacific increases during an El Nino. Warmer surface temperatures yields more evaporation.
I certainly agree with what you are saying. The question is whether this is the whole story: are there other processes at work? Is there anyway to determine if the loss of heat to the atmosphere is the total heat loss?
Retired Engineer John, I can’t see any realistic way to determine that because there are other processes within the atmosphere at play as well.
Pacific winds, West
http://earth.nullschool.net/#current/wind/surface/level/orthographic=-213.84,0.13,1024
Central
http://earth.nullschool.net/#current/wind/surface/level/orthographic=-162.16,0.36,1024
East
http://earth.nullschool.net/#current/wind/surface/level/orthographic=-112.59,0.65,1024
http://earth.nullschool.net/#current/wind/surface/level/orthographic=-151.22,2.87,272
Global view.
Thanks for the clear explanation Bob. I am enjoying your book as well, best 10 bucks I’ve spent in a long time.
mwhite, I’ve been saying “wow” for 5 minutes.
Thank you so much for the links.
Glad you’re enjoying the book, Keitho. Thanks for buying it.
Cheers.
First seen it on notrickszone
http://notrickszone.com/2014/02/06/outstanding-real-time-global-weather-visualization-tool-by-programmer-cameron-beccario/
Pingback: 2014/15 El Niño – Part 3 – Early Evolution – Comparison with 1982/83 & 1997/98 El Niño Events | Bob Tisdale – Climate Observations
Pingback: 2014/15 El Niño – Part 3 – Early Evolution – Comparison with 1982/83 & 1997/98 El Niño Events | Watts Up With That?
bob…I’m not an expert about weather and not a meterologist
do you want to say this year we wouldnt see EL NINO or what ? if you think el nino will come then when ? ASO ? JJA ? or ?
thanks a bunch
bawah ptkp, I’m not a meteorologist either, but I suspect we’ll start to see the sea surface temperature anomalies of the central and eastern equatorial Pacific start to warm in a month or two, but El Nino events don’t reach their peak until Nov-Dec-Jan.
Pingback: The 2014/15 El Niño – Part 4 – Early Evolution – Comparison with Other Satellite-Era El Niños | Bob Tisdale – Climate Observations
Pingback: The 2014/15 El Niño – Part 4 – Early Evolution – Comparison with Other Satellite-Era El Niños | Watts Up With That?
Pingback: The 2014/15 El Niño – Part 5 – The Relationship Between the PDO and ENSO | Bob Tisdale – Climate Observations
Pingback: The 2014/15 El Niño – Part 5 – The Relationship Between the PDO and ENSO | Watts Up With That?
Have just been reading through the comments on the Scribbler blog. And when someone asks him what IPO is an acronym for, he goes onto state that the terms IPO and PDO are used interchangeably. I assume that means he doesn’t know the difference.
Pingback: The 2014/15 El Niño – Part 6 – What’s All The Hubbub About?… | Bob Tisdale – Climate Observations
Pingback: The 2014/15 El Niño – Part 6 – What’s All The Hubbub About?… | Watts Up With That?
Pingback: The 2014/15 El Niño – Part 7 – May 2014 Update and What Should Happen Next | Bob Tisdale – Climate Observations
Pingback: The 2014/15 El Niño – Part 7 – May 2014 Update and What Should Happen Next | Watts Up With That?
Pingback: The 2014/15 El Niño – Part 8 – The Southern Oscillation Indices | Bob Tisdale – Climate Observations
Pingback: The 2014/15 El Niño – Part 8 – The Southern Oscillation Indices | Watts Up With That?
Pingback: Deep Ocean Warming is Coming Back to Haunt Us: Record Warmth for 2014 Likely As Equatorial Heat Rises | Bob Tisdale – Climate Observations
Pingback: The 2014/15 El Niño – Part 9 – Kevin Trenberth is Looking Forward to Another “Big Jump” | Bob Tisdale – Climate Observations
Pingback: The 2014/15 El Niño – Part 9 – Kevin Trenberth is Looking Forward to Another “Big Jump” | Watts Up With That?
Pingback: The 2014/15 El Niño – Part 10 – June 2014 Update – Still Waiting for the Feedbacks | Bob Tisdale – Climate Observations
Pingback: The 2014/15 El Niño – Part 10 – June 2014 Update – Still Waiting for the Feedbacks | Watts Up With That?
Pingback: Is One of the Objectives of All Alarmists to Be a Source of Misinformation? | Bob Tisdale – Climate Observations
Pingback: Is One of the Objectives of All Alarmists to Be a Source of Misinformation? | Watts Up With That?
To avoid admitting that is no such a thing as GLOBAL warming – they concocted that: the missing heat is gone deep down in the ocean, and in few years will surface’’
Dear friends: ‘’if you PUMP warmer water trough a pipe deep down – will surface in a jiffy; because ‘’HEAVIER’’ colder water from above will squeeze the warmer water up, because ‘’warmer’’ water is not as heavy. Same as cooking oil, or fat, doesn’t stay in the middle of the pot of water, or below – because is not as heavy per volume. Having in mind that: that con came from leading Warmist… they are not very smart; only cunning and shameless liars No need to wait few years and see that was no missing warmth surfacing. B] no need to go and look for it; the normal laws of physics are the most reliable guidance. Experiment can be replicated in the kitchen.
Water temp at 4C (39F) is the heaviest – that’s how the learned people of the world invented ‘’kilogram’’ one liter of water (10sm3) of water at 4C is one kg heavy; warmer, OR colder water than 4C expands, and is not as heavy per volume. Therefore: water at 4C goes to the bottom and every layer above is by one degree warmer as it goes to the surface water, which is always the warmest, depends on what latitude, to how high it goes. (Only exception is: water of temp 3C to zero degrees CAN be found just above 4C; but that’s self explanatory why – because from 3C down to zero is not as heavy as at 4C)
2] water is ‘’FLUID’’ and that’s why instantly readjusts itself, by temperature; you cannot have ‘’warmer’’ water below the colder, for more than few seconds, because of readjustment per weights / temperature. Water is not as solid object, which means: you can put block of polystyrene on the bottom, then put brick on the top of it, then put a lump of lead on the top, and will stay that way, BUT with fluid water… NEVER! Don’t let anybody con you that: saltier water can pull and keep higher temp below; because: there isn’t any adhesion between the salt and water molecules. experiment: if you pump via pipe very salty hot water – down to the bottom in a cold-water pot -> the hot-water will drop most of the salt and will surface instantly. To see that adhesion between water and salt are almost non-existent: put a very salty cup of water in a pot of fresh water – stir it few times and the salt will instantly disperse to every other molecule of water. Therefore: the lie about: ”the missing heat is deep down in the oceans” is not helping much the professional conmen
Pingback: The 2014/15 El Niño – Part 11 – Is the El Niño Dying? | Bob Tisdale – Climate Observations
Pingback: The 2014/15 El Niño – Part 11 – Is the El Niño Dying? | Watts Up With That?
Pingback: The 2014/15 El Niño – Part 12 – July 2014 Update – The Feedbacks Need to Kick in Soon | Bob Tisdale – Climate Observations
Pingback: The 2014/15 El Niño – Part 12 – July 2014 Update – The Feedbacks Need to Kick in Soon | Watts Up With That?
Pingback: The 2014/15 El Niño – Part 13 – More Mixed Signals | Bob Tisdale – Climate Observations
Pingback: The 2014/15 El Niño – Part 13 – More Mixed Signals | Watts Up With That?
Pingback: The 2014/15 El Niño – Part 14 – Warm Water Recirculated? | Bob Tisdale – Climate Observations
Pingback: The 2014/15 El Niño – Part 14 – Warm Water Recirculated? | Watts Up With That?
Pingback: The 2014/15 El Niño – Part 15 – August 2014 Update – An El Niño Mulligan? | Bob Tisdale – Climate Observations
Pingback: The 2014/15 El Niño – Part 15 – August 2014 Update – An El Niño Mulligan? | Watts Up With That?
Pingback: The 2014 15 El Niño – Part 15 – September 2014 Update – Still Seeing Mixed Signals | Bob Tisdale – Climate Observations
Pingback: The 2014 15 El Niño – Part 15 – September 2014 Update – Still Seeing Mixed Signals | Watts Up With That?
Pingback: The 2014/15 El Niño – Part 18 – October 2014 Update – One Last Chance? | Bob Tisdale – Climate Observations
Pingback: The 2014/15 El Niño – Part 18 – October 2014 Update – One Last Chance? | Watts Up With That?
Pingback: The 2014 15 El Niño – Part 19 – Is an El Niño Already Taking Place? | Bob Tisdale – Climate Observations
Pingback: The 2014/15 El Niño – Part 19 – Is an El Niño Already Taking Place? | Watts Up With That?
Pingback: Enthusiasm about a Double-Dip El Niño (?) And Global Warming | Bob Tisdale – Climate Observations
Pingback: Enthusiasm about a Double-Dip El Niño (?) And Global Warming | Watts Up With That?
Pingback: The 2014/15 El Niño – November Update – The Little El Niño That Shoulda’-Woulda’-Coulda’ | Bob Tisdale – Climate Observations
Pingback: The 2014/15 El Niño – Part 20 – November Update – The Little El Niño That Shoulda’-Woulda’-Coulda’ | Watts Up With That?
Pingback: Final – The 2014/15 El Niño – Part 22 – January 2015 Update – You Make the Forecasts for the 2015/16 Season * The New World
Pingback: The 2014/15 El Niño Was Not Focused on the Region Used By NOAA for their Oceanic NINO Index | Bob Tisdale – Climate Observations
Pingback: The 2014/15 El Niño Was Not Focused on the Region Used By NOAA for their Oceanic NINO Index | Watts Up With That?
Pingback: Did ENSO and the “Monster” Kelvin Wave Contribute to the Record High Global Sea Surface Temperatures in 2014? | Bob Tisdale – Climate Observations