
Of course they did.
[UPDATE: I’ve added “Sea” to the title to clarify it.]
Those who have followed the 2014/15 El Niño series from its start back in April will recall all the hoopla about the strong downwelling Kelvin wave that was traveling from west to east along the Cromwell Current (aka the Pacific Equatorial Undercurrent). Based on the size of that Kelvin wave, alarmists were anticipating a super El Niño that would cause record-high global surface temperatures, but the super El Niño failed to form.
The strong Kelvin wave earlier this year took a massive volume of warm water that had been below the surface of the West Pacific Warm Pool, where it was not included in the surface temperature record, and allowed that warm water to be spread across the surface of the tropical Pacific, where it was then included in the surface temperature record. The surfaces of the tropical Pacific had to warm in response. They could do nothing else.
But did the warm water released by that Kelvin wave have a noticeable impact on global sea surface temperatures?
QUICKY REMINDER OF THE PRIMARY CAUSE OF THE 2014 RECORD HIGH SURFACE TEMPERATURES
Record-high global sea surface temperatures have occurred in 2014, and annually 2014 is likely to set a new record high. We also know the primary cause: the unusual weather-related surface warming of the eastern extratropical North Pacific. That unusual warming event, also known as “the blob”, was discussed in a number of posts this year, including:
- The Hotspot in the North Pacific (February 2014)
- June 2014 Sea Surface Temperature (SST) Anomaly Update (July 2014)
- On The Recent Record-High Global Sea Surface Temperatures – The Wheres and Whys (August 2014)
And we further discussed the blob and a very likely cause of it in Axel Timmermann and Kevin Trenberth Highlight the Importance of Natural Variability in Global Warming…
For 24 years, from 1989 to 2012, the surface of the North Pacific showed no warming, but climate models showed the surface there should have warmed more than 0.5 deg C in that time. See Figure 1.

Figure 1
If the manmade greenhouse gas-forced climate models used by the IPCC cannot explain the 24-year absence of warming of the surface in the North Pacific, it can’t be claimed that the weather-related warming there in 2013 and 2014 were caused by manmade greenhouse gases. That little bit of common sense eludes alarmists.
BACK TO THE “MONSTER” KELVIN WAVE
As we discussed in the first post in this series, the strong Kelvin wave that formed and traveled from west to east along the equator in the Pacific was caused by a couple of very strong westerly wind bursts. Think of the downwelling (warm) Kelvin wave as a humongous pulse of warm water traveling from west to east, below the surface, being carried eastward by the Cromwell Current. The water in the western equatorial Pacific is naturally warmer than it is in the east, so the pulse of warm water can create greater positive subsurface temperature anomalies as it travels east. See Animation 1, which is an animation of the pentadal (5-day average) subsurface temperature anomaly cross sections available from the NOAA GODAS website. It runs from the first of the year to the end of July 2014.

Animation 1
The complete animation to the end of November is here.
That first downwelling Kelvin wave this year was very strong, the strongest one since 1997, and of course the Kelvin wave(s) in 1997 initiated the 1997/98 super El Niño.
A minor upwelling (cool) Kelvin wave followed the strong downwelling (warm) Kelvin wave in 2014, and the upwelling (cool) Kelvin wave helped to offset a small part of the effects of the strong downwelling (warm) Kelvin wave. That is, the upwelling (cool) Kelvin wave was not comparable in strength to the strong downwelling (warm) Kelvin wave, so the cool one did not negate the warm one. See the Hovmoller diagrams in Figure 2 as well. (The Hovmoller diagrams in Figure 2 and 3 are also available from the available from the NOAA GODAS website. I’ve included 1997 as a reference in both.)
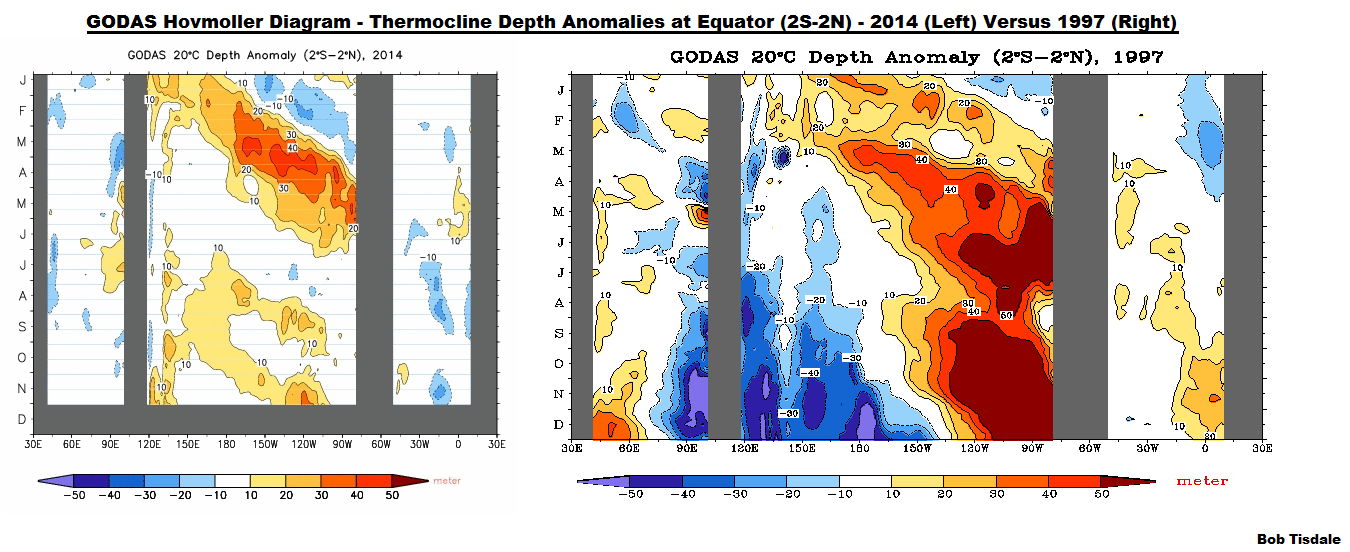
Figure 2
We’ve discussed other reasons why this El Niño failed to turn into a super El Niño.
In 1997, there were a series of westerly wind bursts throughout the year that helped to pump more warm water from the western to the eastern tropical Pacific, while this year there were no additional westerly wind bursts to help reinforce the evolution of the El Niño. 1997 was freakish because the weather conditions in the western tropical Pacific all aligned to help the El Niño evolve, and 2014 was freakish because the weather conditions in the western tropical Pacific failed to help the evolution. See the Hovmoller diagrams in Figure 3 for a comparison of NOAA zonal wind stress along the equator in 1997 and 2014.

Figure 3
We discussed another unusual event this year…how part of the original Kelvin wave broke out of the Cromwell Current just east of the dateline. See the posts here and here. That warm water was carried back (south of the equator) to the west where it reentered the Cromwell Current and is now being carried eastward, providing the fuel for the late evolution of the weak-to-moderate El Niño conditions we have now.
BUT THE FIRST KELVIN WAVE CARRIED AN ENORMOUS AMOUNT OF WARM WATER EAST AND THAT WARM WATER DIDN’T JUST DISAPPEAR
That’s very true. While some of the warm water that was part of the first downwelling Kelvin wave this year broke away and is now being recirculated along the equator, the rest of that the warm water from that Kelvin wave didn’t simply disappear. And the upwelling (cool) Kelvin wave that followed it wasn’t strong enough to counter it fully. So the warm water has to be somewhere, and the likely place is the surface of the tropical Pacific.
Because that warm water didn’t really make its presence known in the NINO3.4 region until recently (in response to the second and third downwelling Kelvin waves), the impacts of the strong Kelvin wave earlier this year will not register on the “official” El Niño records. But that doesn’t mean that warm water didn’t rise to the surface of the tropical Pacific and influence surface temperatures there. Figure 4 presents a map of the average sea surface temperature anomalies of the tropical and North Pacific for the past 6 months: May through October 2014. I’ve highlighted (1) the NINO3.4 region (5S-5N, 170W-120W), upon which NOAA’s “official” ENSO index ONI is based; (2) the tropical Pacific (24S-24N, 120E-80W), which is also directly impacted by El Niño and La Niña events; and (3) the extratropical North Pacific (24N-65N, 120E-80W), where the blob existed in 2013 and 2014.

Figure 4
You’ll note the coordinates carry over into the Caribbean Sea, the Gulf of Mexico and Hudson Bay. Those small portions outside the Pacific have little impact on this simple analysis.
Looking at the average sea surface temperature anomalies for the past 6 months in Figure 4, we can see a number of things. The greatest anomalies occurred in the extratropical North Pacific. But the map can give the wrong impression of the size of the extratropical North Pacific. The extratropical North Pacific actually covers a surface area that is almost 2 ½ times smaller than the tropical Pacific. Then again, the temperature anomalies in the extratropical North Pacific were much greater than in the tropical Pacific.
Also visible in the map: the warming in the tropics avoided the NINO3.4 region. That is, in response to the Kelvin waves this year, the primary warming over the past 6 months occurred east and west of the NINO3.4 region. But NOAA uses NINO3.4 region to determine if an El Niño has occurred.
We can confirm that El Niño conditions have hardly existed (in monthly data) in the NINO3.4 region by looking at the sea surface temperature anomalies there, Figure 5. They’ve reached the threshold a couple of times (and they will be higher in November).

Figure 5
If we look at the sea surface temperature anomaly data for the entire tropical Pacific, however, Figure 6, we would think an El Niño had been taking place for a good part of 2014. Sea surface temperature anomalies across the entire tropical Pacific this year are warmer than the peaks for period of 2002 to 2007 when 3 El Niño events occurred. See the ONI index to confirm that 3 El Niños occurred then.

Figure 6
NOTE: In the post Axel Timmermann and Kevin Trenberth Highlight the Importance of Natural Variability in Global Warming…, we discussed coastally trapped Kelvin waves. It was topic introduced by Kevin Trenberth in the interview that was discussed in that post. As we noted in that post, while coastally trapped Kelvin waves do exist, it was difficult to see any evidence of them in the sea surface temperature records this year. That doesn’t mean they didn’t occur; they’re just difficult to see. [End note.]
Looking at Figure 6, it’s blatantly obvious that an ENSO-related warming event this year impacted the sea surface temperature anomalies of the tropical Pacific, and based on the size of the tropical Pacific, that ENSO-related warming had to have had some impact on the global data. But some people are hard to convince…
DID THE ENSO-RELATED SURFACE WARMING OF THE TROPICAL PACIFIC HAVE A NOTICEABLE IMPACT ON GLOBAL SEA SURFACE TEMPERATURES THIS YEAR?
A simple way to determine the impact of the surface warming in the tropical Pacific this year is to remove the sea surface temperature data of both the tropical Pacific and the extratropical North Pacific from the global data. We can then add the data for those regions back in and check the results.
If we know the surface areas of those two regions, we can then weight the data for those two regions and subtract the data for those two subsets from the global data.
The tropical Pacific (24S-24N, 120E-80W) is not a small portion of the global oceans. As shown above in Figure 4, it stretches almost halfway around the globe. It covers a surface area of roughly 88 million km^2, or about 17% of the surface of the Earth, or about 24% of the surface of the global oceans. The extratropical North Pacific (24N-65N, 120E-80W) is considerably smaller. It covers a surface area of about 37 million km^2, or about 7% of the surface of the globe, or about 10% of the surface of the global oceans.
Figure 7 presents the monthly global sea surface temperature anomalies (Reynolds OI.v2 data) from November 1981 to October 2014. It serves as our reference. There should be no doubt that global sea surface temperatures reached record-highs in 2014.

Figure 7
Using the area-weighting factors for the extratropical North Pacific (0.1) and the tropical Pacific (0.24), the sea surface temperature data for those two regions were subtracted from the global data in Figure 8. Without the extratropical North Pacific and the tropical Pacific, the adjusted global sea surface temperature data do not show the extraordinary warming in 2014. ENSO-related peaks in 1998 and 2010 were comparable or greater.

Figure 8
NOTE: We’ve discussed how Kevin Trenberth now suggests that El Niño events can cause the long-term warming of global surface temperatures. The most recent post was The 2014/15 El Niño – Part 9 – Kevin Trenberth is Looking Forward to Another “Big Jump”. And there are other related posts linked to it. The El Niño-caused upward shifts were evident in Figure 8, so I’ve highlighted them in Figure 9.

Figure 9
[End note.]
Back to our discussion of the impact of the warming of the tropical Pacific in 2014:
In Figure 8 above, we can see that global sea surface temperatures would not be at record high levels without the impacts of the extratropical North Pacific and the tropical Pacific.
Let’s add the data for the tropical Pacific back in, but exclude the extratropical North Pacific. See Figure 10. In that case, they’d be warmer, closer to record highs, but not at record highs.

Figure 10
On the other side of the coin, if we exclude the tropical Pacific data but include the extratropical North Pacific data, Figure 11, the addition of the extratropical North Pacific data puts the abridged global sea surface temperature data at record levels in 2014.

Figure 11
So we’ve been correct to say that the unusual weather-related warming event in the extratropical North Pacific is responsible for the record-high sea surface temperatures in 2014.
CLOSING
If there was any doubt, the ENSO-related warming of the tropical Pacific in 2014 did contribute to the record high global sea surface temperatures, but without the exceptional weather-related warming of the extratropical North Pacific (Figure 12), 2014 would not have been a record warm sea surface year globally (Figure 7).

Figure 12
And for those of you who want to argue about the warm water for the Kelvin wave, also see the post The 2014/15 El Niño – Part 2 – The Alarmist Misinformation (BS) Begins.
Cheers.


Reblogged this on CRIKEY !#&@ …… IT'S THE WEATHER CYCLES and commented:
BOB TISDALE investigates the causes of the record warm global temperatures for 2014
He concludes
“If there was any doubt, the ENSO-related warming of the tropical Pacific in 2014 did contribute to the record high global sea surface temperatures, but without the exceptional weather-related warming of the extratropical North Pacific (Figure 12), 2014 would not have been a record warm sea surface year globally (Figure 7).
With the cooling of the Antartic and arctic oceans , l am surprised at record global SST’s
Is there a weighting issue re: the data collection of SST’s?
Here is the data, readily accessible to everyone, that shows what happens temperature-wise in the oceans. Good job by NOAA to provide access to “unadjusted” raw data. What seems to be missing is an intelligent and convincing interpretation of what lies in front of our eyes.
Along comes Bob Tisdale who gives us a convincing, logically coherent explanation of what seems to be happening. Isn’t that something we would expect and would have expected already a long time ago, from those well payed and dedicated scientists who are hired by the IPCC and universities around the world to shed light on some of the mysteries of this planet’s climate?
Thanks Bob!
Thanks Bob, I do love looking at your graphs and animations. One amateur question: Doesn’t Figure 12 HAVE to be related to the California drought?
Hi Bill. Yup, the blob in the eastern extratropical North Pacific has been linked to the “ridiculously resilient ridge”, both of which have been tied to the California drought.
Cheers.
Click to access california_drought_report.pdf
I believe that this is related to that discussion. Also it is pretty amazing that Richard Seager did not conclude that Global Warming was implicated. And he may have hypothesized another driver of California Drought in addition to the RRR or is speculating on the cause of the RRR.
You may find my analysis of the possible sequence of the PDO and AMO in this article http://econintersect.com/b2evolution/blog1.php/2014/12/08/december-8-weather-and-climate-report-looking-ahead-to-the-state-of-ocean-cycles-in-2040 that I published last night of interest. What I am talking about is at the very end of my article.where I venture to project the sequence of phase changes in the PDO and AMO. Actually I am taking that information from another paper but I am interpreting the impact on U.S. climate by decade through 2050. Since it seems the ratio of La Nina’s to El Nino’s varies by the phase of the PDO, it would seem that there is a connection there with the “Hiatus” and the probably sequence of atmospheric temperature changes.
I also noticed some change in wording in the NOAA ENSO Report where instead of projecting an El Nino they are now projecting an El Nino or “Warm – Neutral Conditions into Mid 2015. I believe that wording is backing off from the wording in the prior week. We had a week of very unfavorable SOI (for the development of an El Nino) but that may have changed as of today. .
Thanks for the links, Sig Silber.
Pingback: Final – The 2014/15 El Niño – Part 22 – January 2015 Update – You Make the Forecasts for the 2015/16 Season | Bob Tisdale – Climate Observations
Pingback: Final – The 2014/15 El Niño – Part 22 – January 2015 Update – You Make the Forecasts for the 2015/16 Season * The New World
Pingback: Alarmists Bizarrely Claim “Just what AGW predicts” about the Record High Global Sea Surface Temperatures | Bob Tisdale – Climate Observations
Pingback: Alarmists Bizarrely Claim “Just what AGW predicts” about the Record High Global Sea Surface Temperatures in 2014 * The New World
Pingback: On the Biases Caused by Omissions in the 2014 NOAA State of the Climate Report | Bob Tisdale – Climate Observations
Pingback: On the Biases Caused by Omissions in the 2014 NOAA State of the Climate Report * The New World
Pingback: North Pacific Update: The Blob’s Strengthening Suggests It’s Not Ready to Depart | Bob Tisdale – Climate Observations
Pingback: North Pacific Update: The Blob’s Strengthening Suggests It’s Not Ready to Depart | Watts Up With That?
Pingback: North Pacific Update: The Blob’s Strengthening Suggests It’s Not Ready to Depart | I World New
Pingback: Weak El Niños and La Niñas Come and Go from NOAA’s Oceanic NINO Index (ONI) with Each SST Dataset Revision | Bob Tisdale – Climate Observations
Pingback: Weak El Niños and La Niñas Come and Go from NOAA’s Oceanic NINO Index (ONI) with Each SST Dataset Revision | Watts Up With That?
Pingback: The 2014/15 El Niño Was Not Focused on the Region Used By NOAA for their Oceanic NINO Index | Bob Tisdale – Climate Observations
Pingback: The 2014/15 El Niño Was Not Focused on the Region Used By NOAA for their Oceanic NINO Index | Watts Up With That?
Pingback: NOAA: El Niño ei alkanutkaan viime vuonna | Roskasaitti
Pingback: A Return to the Question “Was 2014 the warmest year?” | Bob Tisdale – Climate Observations
Pingback: A Return to the Question “Was 2014 the warmest year?” | Watts Up With That?
Pingback: An August 2015 Update on The Blob | Bob Tisdale – Climate Observations
Pingback: August 2015 Update for The Blob | Watts Up With That?
Pingback: Tired of the Claims of “Warmest Ever” Month and Year? They Will Likely Continue Next Year | Bob Tisdale – Climate Observations
Pingback: Tired of the Claims of “Warmest Ever” Month and Year? They Will Likely Continue Next Year | Watts Up With That?
Pingback: THE BLOB Seems to Be Disappearing at the Surface – But Will It Reemerge? | Bob Tisdale – Climate Observations
Pingback: THE BLOB Seems to Be Disappearing at the Surface – But Will It Reemerge? | Watts Up With That?