
I was visiting family in the Northeast U.S. when Sandy came ashore, so I was without power for most of last week. Since my return home, I’ve been catching up with all of the nonsense surrounding Hurricane/Extratropical Storm/Hybrid Storm Sandy. There have been hundreds of articles and blog posts that include references to climate change, global warming, and the warming oceans and their assumed impacts on Sandy. Yet no one has bothered to plot the long-term sea surface temperature anomalies for Sandy’s track. So we’ve had lots of baseless claims. Will the authors of those posts and articles feel foolish when they discover sea surface temperatures for Sandy’s path haven’t warmed in 70+ years? For those reading this post, who have access to the authors of those articles or the blog posts, feel free to leave them a link or two to this post.
The most absurd claim was made by Brian Reynolds in his post How a Warm Earth fueled Hurricane Sandy at The Energy Collective, which heralds itself as “The world’s best thinkers on energy and climate”. It was the topic of discussion in the post Frankenstorm-itis: Five degrees of Separation from Reality and Eleventy Gazillion Joules Under the Sea by David Middleton at WattsUpWithThat.
Apparently the “world’s best thinkers on energy and climate” rely on thought and not on data, because Brian Reynolds’s preposterous claim is clearly fantasy:
The Atlantic ocean [sic] is five degrees warmer than is was when most of you were born. Let that sink in for a minute. The entire Atlantic ocean [sic] averages five degrees warmer.
Oy! Five degrees. He must believe most of us were born just after the last glacial period. That’s older than Mel Brooks’ 2000 Year Old Man.
What could that “best thinker” have been thinking? Then when he was questioned about it, Brian Reynolds wrote in a comment:
The point of this piece isn’t the exact temperature of the ocean, which is admittedly hard to calculate (You’ll note in reading one other comments that you don’t agree with me or one another after all) but rather that the earth isn’t a closed system.
Actually, Brian, you can’t dismiss your error and state that it’s pointless. You wouldn’t have written what you wrote if you thought it was pointless. Also, sea surface temperature data is available to the public through multiple resources (NOAA’s NOMADS website or the KNMI Climate Explorer) so there are no calculations involved. All you have to do is enter coordinates and the websites produce the data. If you had done that with a long-term sea surface temperature dataset like the Hadley Centre’s HADISST, you would have discovered that the sea surface temperatures anomalies of Sandy’s storm track (12N-40N, 80W-70W) haven’t warmed since 1938, when the another super storm hit the Northeast U.S. See Figure 1.
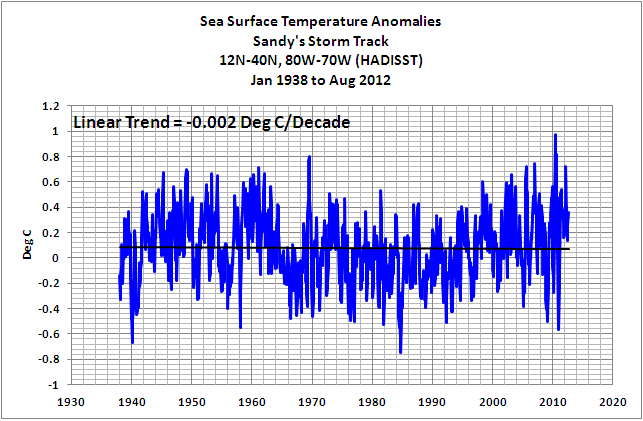
Figure 1
The coordinates are based on the storm-track map from the Jacksonville.com, which I’ve annotated in Figure 2.

Figure 2
For the extratropical portion of the path (24N-40N, 80W-70W), Figure 3, the sea surface temperature anomalies have actually cooled since 1938. It’s not a great deal of cooling, but the trend is clearly negative.

Figure 3
THERE IS NO EVIDENCE OF AN ANTHROPOGENIC GLOBAL WARMING SIGNAL IN THE SATELLITE-ERA SEA SURFACE TEMPERATURE DATA
The satellite-era sea surface temperature records indicates El Niño and La Niña events are the primary causes of the warming of global sea surface temperature anomalies over the past 30 years, not manmade greenhouse gases. I’ve searched sea surface temperature records for more than 4 years, and I can find no evidence of an anthropogenic greenhouse gas signal. That is, the warming of the global oceans has been caused by Mother Nature, not anthropogenic greenhouse gases.
I’ve recently published an e-book (pdf) about the phenomena called El Niño and La Niña. It’s titled Who Turned on the Heat? with the subtitle The Unsuspected Global Warming Culprit, El Niño Southern Oscillation. It is intended for persons (with or without technical backgrounds) interested in learning about El Niño and La Niña events and in understanding the natural causes of the warming of our global oceans for the past 30 years. Because land surface air temperatures simply exaggerate the natural warming of the global oceans over annual and multidecadal time periods, the vast majority of the warming taking place on land is natural as well. The book is the product of years of research of the satellite-era sea surface temperature data that’s available to the public via the internet. It presents how the data accounts for its warming—and there are no indications the warming was caused by manmade greenhouse gases. None at all. The same holds true for Ocean Heat Content data. The warming of the global oceans to 700 meters since 1955 can also be easily explained through natural variables.
Who Turned on the Heat? was introduced in the blog post Everything You Every Wanted to Know about El Niño and La Niña… …Well Just about Everything. The Updated Free Preview includes the Table of Contents; the Introduction; the beginning of Section 1, with the cartoon-like illustrations; the discussion About the Cover; and the Closing.
Please buy a copy. (Credit/Debit Card through PayPal—you don’t need a PayPal account). It’s only US$8.00.
You’re probably asking yourself why you should spend $8.00 for a book written by an independent climate researcher. There aren’t many independent researchers investigating El Niño-Southern Oscillation or its long-term impacts on global surface temperatures. In fact, if you were to perform a Google image search of NINO3.4 sea surface temperature anomalies, the vast majority of the graphs and images are from my blog posts. Try it. Cut and paste NINO3.4 sea surface temperature anomalies into Google. Click over to images and start counting the number of times you see Bob Tisdale.
By independent I mean I am not employed in a research or academic position; I’m not obligated to publish results that encourage future funding for my research—that is, my research is not agenda-driven. I’m a retiree, a pensioner, with a background in fluid dynamics. The only funding I receive is from book sales and donations at my blog. Also, I’m independent inasmuch as I’m not tied to consensus opinions so that my findings will pass through the gauntlet of peer-review gatekeepers. Truth be told, it’s unlikely the results of my research would pass through that gauntlet because the satellite-era sea surface temperature data contradicts the tenets of the consensus.
SOURCE
The Sea Surface Temperature anomaly data used in this post is available through the KNMI Climate Explorer website.


Pingback: data checking the storm … | pindanpost
Pingback: Sea Surface Temperature Anomalies along Sandy’s Track Haven’t Warmed in 70+ Years | Bob Tisdale – Climate Observations | Cranky Old Crow
Pingback: October 2012 Sea Surface Temperatures and Anomalies Along Sandy’s Path Were NOT Unusual | Bob Tisdale – Climate Observations
Pingback: The Impact of Sandy on Sea Surface Temperature Anomalies Along Its Track | Bob Tisdale – Climate Observations
Pingback: Inverse hockey stick – Hurricane Sandy cools the ocean | Watts Up With That?
Pingback: Did a warming sea intensify Sandy? The data don’t show it – The Star-Ledger | Muwaslat
Pingback: Dear Chicken Little: The Sky Is Falling (It’s Snowing) But Sea Surface Temperature Anomalies Off New England Are NOT Unusual | Bob Tisdale – Climate Observations
Pingback: Bob Tisdale shows how ‘Forecast the Facts” Brad Johnson is fecklessly factless about ocean warming | Watts Up With That?
Pingback: Video: The Impact of Manmade Global Warming on a Blizzard Called Nemo and on Hurricane Sandy | Bob Tisdale – Climate Observations
Pingback: New video from Bob Tisdale explains The Impact of Manmade Global Warming on a Blizzard Called Nemo and on Hurricane Sandy | Watts Up With That?
Reblogged this on Real Science.
Pingback: Joe Romm Predicts “…All But Certain Ruin for Modern Civilization…” from a NOAA Fisheries Press Release | Bob Tisdale – Climate Observations
Pingback: Joe Romm Predicts “…All But Certain Ruin for Modern Civilization…” from a NOAA Fisheries Press Release | Watts Up With That?
Pingback: Hurricane Main Development Region Sea Surface Temperatures & Anomalies – Plus a Couple of Other Regions | Bob Tisdale – Climate Observations
Pingback: Hurricane Main Development Region Sea Surface Temperatures & Anomalies – Plus a Couple of Other Regions | Watts Up With That?
Pingback: Mid-July 2013 Hurricane Development Region Sea Surface Temperature Anomalies | Bob Tisdale – Climate Observations
Pingback: Mid-July 2013 Hurricane Development Region Sea Surface Temperature Anomalies | Watts Up With That?
Pingback: Mid-August Hurricane Development Region Sea Surface Temperature Anomaly Update | Bob Tisdale – Climate Observations
Pingback: Mid-August Hurricane Development Region Sea Surface Temperature Anomaly Update | Watts Up With That?
Pingback: Open Letter to the Executive Producers of YEARS of LIVING DANGEROUSLY | Bob Tisdale – Climate Observations
Pingback: Open Letter to the Executive Producers of YEARS of LIVING DANGEROUSLY | Watts Up With That?
Pingback: Hurricane Development Region Sea Surface Temperature Anomalies as We Start the 2014 Season | Bob Tisdale – Climate Observations
Pingback: Hurricane Development Region Sea Surface Temperature Anomalies as We Start the 2014 Season | Watts Up With That?
Pingback: Tropical Storm Arthur – There Is Nothing Unusual About the Sea Surface Temperatures Off the East Coast of the U.S. | Bob Tisdale – Climate Observations
Pingback: Tropical Storm Arthur – There Is Nothing Unusual About the Sea Surface Temperatures Off the East Coast of the U.S. | Watts Up With That?
Pingback: Recent Hawaiian Tropical Cyclones – Sea Surface Temperature Anomalies of the Storm Tracks | Bob Tisdale – Climate Observations
Pingback: Recent Hawaiian Tropical Cyclones – Sea Surface Temperature Anomalies of the Storm Tracks | Watts Up With That?
Pingback: Hurricane Development Region Sea Surface Temperature Update – August 2014 | Bob Tisdale – Climate Observations
Pingback: Hurricane Development Region Sea Surface Temperature Update – August 2014 | Watts Up With That?
Pingback: Golly,Wollie!
Pingback: A Preliminary Look at the Sea Surface Temperature Anomalies Since 1940 along Hurricane Joaquin’s Forecasted Storm Track | Bob Tisdale – Climate Observations
Pingback: A Preliminary Look at the Sea Surface Temperature Anomalies Since 1940 along Hurricane Joaquin’s Forecasted Storm Track | Watts Up With That?