
This post compares the responses of global surface temperature anomalies and lower troposphere temperature anomalies for the 2015/16 El Niño and the comparatively strong 1997/98 El Niño. Datasets included are lower troposphere temperature data from RSS and UAH and land-ocean surface temperature products from NASA GISS, NOAA NCEI and UK Met Office.
INTRODUCTION
Referring to the sea surface temperatures of the NINO3.4 region of the east/central equatorial Pacific, the current 2015/16 El Niño is comparable in strength to the 1982/83 and 1997/98 El Niños. Due to the differences between sea surface temperature datasets, however, it is impossible to know which El Niño is actually the strongest. (See the post here.)
In this post, we’re comparing the evolutions of global surface temperature anomalies (GISS LOTI, NOAA NCEI, and UKMO HADCRUT4) and lower troposphere temperature anomalies (RSS and UAH) for 24-month periods starting in 1997 and 2015. We’re excluding the responses to the 1982/83 El Niño because the 1982 eruption of El Chichon impacted global surface temperatures in those two years. To better align the data for comparison purposes, the data are referenced (zeroed) to the average temperature anomalies for the January to October of 1997 and 2015. The top graphs in each of the figures include the monthly data. Due to the volatility of the some datasets, the bottom graphs include the data smoothed with 3-month running-average filters. I’ve listed the global temperature difference between 1997 and 1998 in the top graphs, so that you can get an idea of the expected rises in global surface temperatures from 2015 to 2016.
Due to data availability, the end months of the data in 2015 vary.
Let’s start with the…
LOWER TROPOSPHERE TEMPERATURE ANOMALIES
The RSS lower troposphere temperature (Figure 1) data are here. The RSS data run through December 2015. The UAH data (Figure 2) are here. The UAH data end in November 2015 as of this writing.

Figure 1
# # #

Figure 2
We should expect lower troposphere temperatures to continue to rise through March/April of 2016 and then decline through 2016…and then continue to drop into 2017 in response to the 2016/17 La Niña, assuming one forms (reasonable assumption).
LAND+OCEAN SURFACE TEMPERATURES
Figure 3 includes the GISS Land-Ocean Temperature Index (data here). The NOAA/NCEI land+ocean surface temperature data (here) are shown in Figure 4. Both the GISS and NOAA data are available through November 2015. The UKMO as of this writing still have not published their November 2015 HadCRUT4 data (here), so they end in October in Figure 5.
Note that the scales of the y-axis are smaller in Figures 3 to 5 than they were in Figures 1 and 2.

Figure 3
# # #

Figure 4
# # #
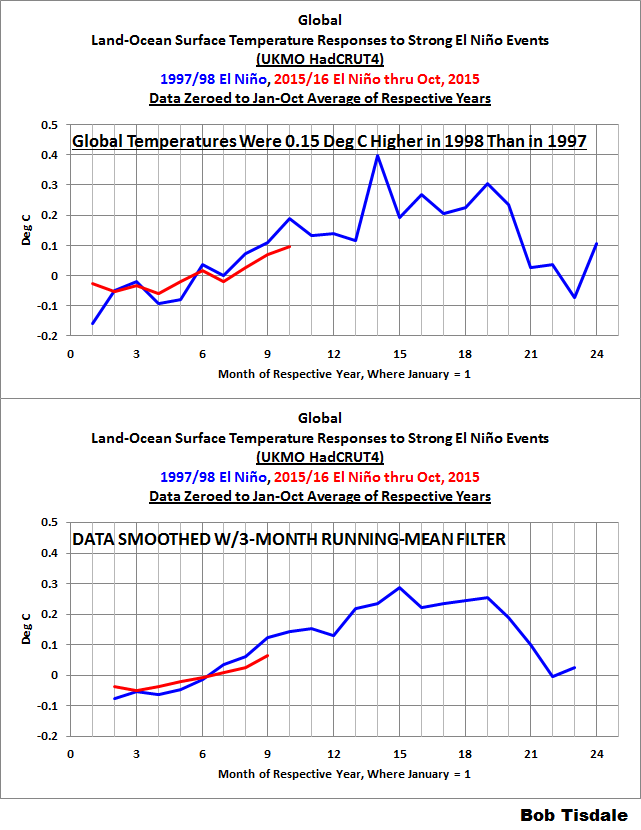
Figure 5
We might expect the global surface temperatures to peak in February or March of 2016, assuming 2016 surface temperatures mimic those of 1998. Surface temperatures remained elevated through to the second half of 1998, when they began to show noteworthy drops. Once again, we could expect surface temperatures to continue to drop in 2017 is response to the 2016/17 La Niña…if one forms, which is likely.
CLOSING
The responses of global surface and lower troposphere temperatures in 2015 are what we would expect for a strong El Niño. In 2016, if global surface and lower troposphere temperatures continue to respond as they had to the 1997/98 El Niño, we can expect global surface and lower troposphere temperatures to be higher in 2016 than they were in 2015.
I’ll try to update these graphs every couple of months.
FOR THOSE NEW TO DISCUSSIONS OF EL NIÑO EVENTS
I discussed in detail the naturally occurring and naturally fueled processes that cause El Niño events (and their long-term aftereffects) in Chapter 3.7 of my recently published free ebook On Global Warming and the Illusion of Control (25 MB). For those wanting even more detail, see my earlier ebook Who Turned on the Heat? – The Unsuspected Global Warming Culprit: El Niño-Southern Oscillation. Who Turned on the Heat? only costs $5.00 (US).


Thanks. Quite helpful.
Thanks, Bob.
This 2015/16 El Niño will no doubt share some aspects with the 1997/98 El Niño, but thanks to you we’ll be able to observe the differences. And hopefully we will learn something about ENSO, the greatest energy-transport phenomenon on Earth.
Long-known by the Incas in 1532 when Pizarro came to Perú, we are still learning.
I wonder how much ocean heat is in the top few meters now compared to previous El Nino’s. My gut feeling is that eventually heat released from the ocean and measured in the troposphere comes to a sudden stop and does not reach previous levels as we near the end of this present imbalance between incoming/stored and outgoing/released solar heat. Then begins the ramp down. Will we reach the same levels as the medieval warm period? Maybe. Glaciers are uncovering flora put there during that period. But make no mistake, we will eventually not have enough stored ocean heat to keep us warmly wrapped in this present warm regime.
I left a comment but it has disappeared and is not in your usual moderation stage.
Higher global temperatures in 2016 than in 2015 seem to be possible, but are not sure in any way. I think it depends on the speed of the El Niño decay and the time and strength of La Niña development… https://wobleibtdieglobaleerwaermung.wordpress.com/2015/12/15/wird-nach-2014-und-2015-auch-2016-kein-global-rekordwarmes-jahr-sind-weltklimakonferenzen-voellig-sinnlos/
Happy New Year!
Thanks for interesting plots! However, when you say “To better align the data for comparison purposes, the data are referenced (zeroed) to the average temperature anomalies for the January to October of 1997 and 2015.” , I think this may underscore the very large differences in ENSO-values between 1996 and 2014. While the last months of 1996 and the first 2-3 months of 1997 had ENSO values of around -0,5, the last months of 2014 and the first months of 2015 had ENSO values of +0,5. Hence, although the maximal ENSO values of 2015 are comparable to 1997, the ‘delta values’ were much larger in 1996-97-98 than 2014-15-16. This could easily translate in a smaller jump in values for RSS and UAH the next couple of months, as we observed in the first 4 months og 1998.
Tor Ole Klemsdal, I agree. It will be easier to present that possible effect using annual data. With the annual data we simply zero the graphs at 1996 and 2014.
Thank’s for your comment! I think that within 2-3 months we will be able to se if 2016 stands a chance against 1998 as regards UAH and RSS – maybe 1997 will be a better baseline anyway… As regards GISS, HadCrut4 and NOAA, I doubt that the year 2016 will be warmer than 2015, mainly because it seems that the “blob” is finally coming to an end.
Tor Ole Klemsdal, I hope you’re right about the surface temp datasets and The Blob. It would really be a treat to be able to say that The Blob gave record highs in 2014 but took them away in 2016. We’ll have to watch and see.
Cheers.
So this is a study of El Nino on the global atmospheric temperatures, and it seems to indicate a lag – which I guess is to be expected.
But to what extent are we comparing ‘like with like’ *sources* here? When did the 97/98 El Nino peak, and when did it subside? (From what I can see at http://www.esrl.noaa.gov/psd/enso/mei/ 97/98 had a second peak in the spring of ’98. It remains to be seen whether this one does the same.)
I guess it all depends on the next 3 months or so. Will the current El Nino continue to subside (in which case it will not be comparable with 97/98) or will it emulate 97/98 and make a second peak in early 2016?
I see that my previous question is answered here . . . http://wattsupwiththat.com/2016/01/04/evolutions-of-global-surface-and-lower-troposphere-temperature-anomalies-in-responses-to-the-199798-and-201516-el-ninos/#comment-2112786.
Bob, I made a small operation: The RSS-data up to 12/15 were recalculated with the suspicious method “F/R 2011” which is not very physically and in 2011 it was made to boost trends up. Anyway, the paper is reviewed and here is the result: http://www.dh7fb.de/ninos/rssenso.gif . The RSS were “infected” by ENSO with about 0.13K because the MEI-Index was positive during all the year due to the timelag of 5 month for RSS. So after 2011 the method dosen`t boost the trends, it makes the hiatus in the tropospheric temps clearer. And there is still the “blopp” which is not recalculated with FR11….
Frank says: “Bob, I made a small operation: The RSS-data up to 12/15 were recalculated with the suspicious method ‘F/R 2011′”….
What is “the suspicious method ‘F/R 2011′”?
http://iopscience.iop.org/article/10.1088/1748-9326/6/4/044022/meta;jsessionid=B1DB250386DBFAA74C5187901996C0D4.c2.iopscience.cld.iop.org
Frank, I suspected that you were talking about Foster and Rahmstorf (20111) after I posted my comment.
Your analysis only appears to have ENSO as a factor, but Foster and Rahmstorf included ENSO (MEI), volcanic aerosols (Sato AOD) and solar (PMOD TSI), so your comparisons are not the same. Also you used annual data while they used monthly data.
Last, whatever coefficient you used for your ENSO (MEI) adjustment appears to only have accounted for a small portion of the ENSO component in the RSS TLT data.
Yes, I only used ENSO as a factor. Between 1999 and 2015 there were no volcanos with impacts on AOD. The solar variation in FR11 has a very small influence, so the failure can’t be great. And of coures I replicated FR11 for ENSO correctly: They and me used monthly data and then generated the new annual averages. The coefficient for ENSO in RSS is 0.13 and the timelag is 5 month ( you can see it in the paper, I posted the link) and you are right, the method is not very physically ( as I wrote) , anyway it shows the difference in the results after 2011. The resulting trend is smaller, not greater as it maybe was in the minds of the the authors as they wrote their paper in 2011.
Frank, Figure 7 from Foster and Rahmstorf 2011 disagrees with your claim “The solar variation in FR11 has a very small influence, so the failure can’t be great.”
Also, I should have mentioned this earlier: You can’t use regression analysis to remove the effects of ENSO on global surface temperatures. See:
And:
Cheers
PS: I commend you for your examinations of data, so please do not take my comments the wrong way.
Pingback: Annual Global Lower Troposphere Temperature (TLT) Anomaly Update – Distant Third Warmest for 2015 | Bob Tisdale – Climate Observations
Pingback: Annual Global Lower Troposphere Temperature (TLT) Anomaly Update – Distant Third Warmest for 2015 | Watts Up With That?
Pingback: Meteorological Year (December to November) Global Temperature Product Comparison through 2015 | Bob Tisdale – Climate Observations
Pingback: Watts Up With That?
Pingback: March 2016 Update of Global Temperature Responses to 1997/98 and 2015/16 El Niño Events | Bob Tisdale – Climate Observations
Pingback: March 2016 Update of Global Temperature Responses to 1997/98 and 2015/16 El Niño Events | Watts Up With That?